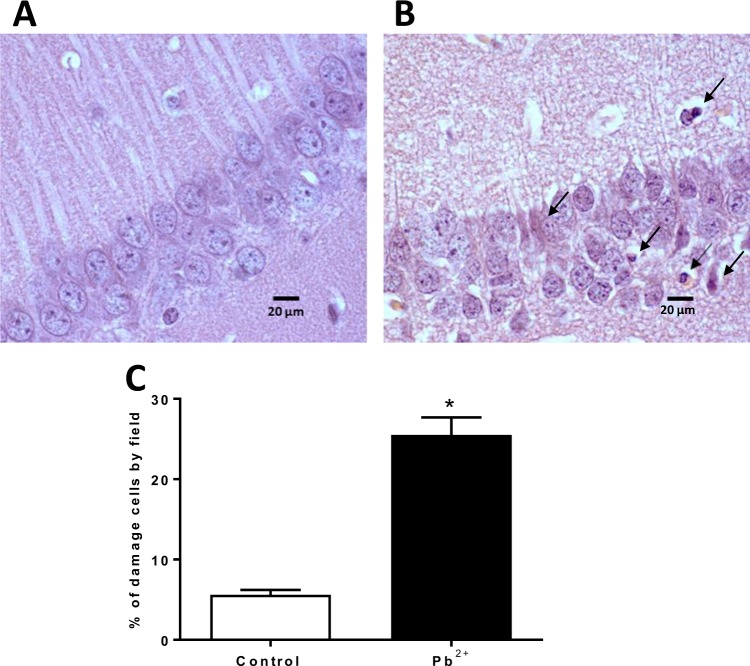
Figure 8.
Representative photomicrographs of hematoxylin-eosin-stained hippocampus sections (100x) of control and Pb2+ groups. (A) Control group, normal cells exhibited round-shaped and pale-stained nuclei. (B) Pb2+ group, dead cells exhibited a shrunken cytoplasm with pyknotic nuclei (black arrows). (C) Percentage of cellular damage in the hippocampal region of mice exposed to Pb2+. Values are expressed as the percentage of damaged cells counted in ten fields per area, in three slides per mouse. *P < 0.001 vs. control, T-test and Mann-Whitney test.

