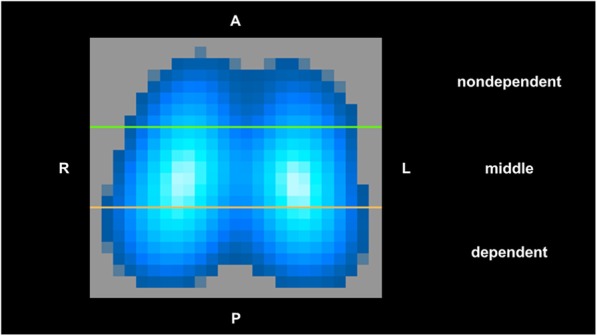
Fig. 1.

Representative image of regional distribution of pulmonary ventilation as recorded by electrical impedance tomography (EIT) in one piglet from the control group. Three regions-of-interest (ROIs) of the same vertical height were constructed from top (anterior) to bottom (posterior) of the lung: nondependent, middle, and dependent ROI. In this ventilation map, lighter blue indicates greater ventilation than darker blue, with white representing the greatest ventilation. A = anterior; P = posterior; L = left; R = right
