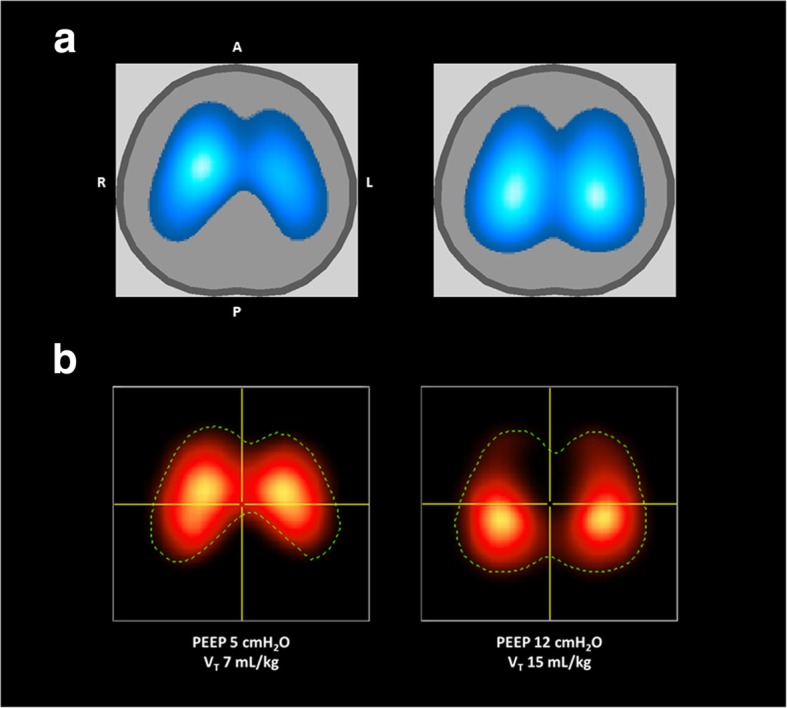
Fig. 3.

Representative images of regional distribution of pulmonary ventilation (a) and perfusion (b) at two different PEEP and VT levels as recorded by electrical impedance tomography (EIT) in one piglet from the injured group. In the ventilation maps (a), lighter blue indicates greater ventilation than darker blue, with white representing the greatest ventilation. Similarly, in the perfusion maps (b), the lighter red indicates greater perfusion than darker red, with yellow indicating the greatest perfusion. The dotted line in the perfusion maps shows the contour of the corresponding ventilation map (i. e., the corresponding pulmonary ventilation area studied at the same point in time, hence under the same mechanical ventilation settings). PEEP = positive end-expiratory pressure. VT = tidal volume.
A = anterior; P = posterior; L = left; R = right (all images)
