. 2019 Dec 27;8(1):A0078. doi: 10.5702/massspectrometry.A0078

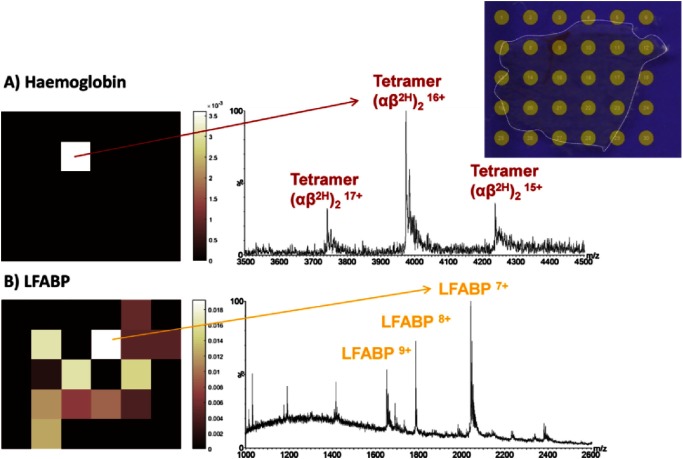
Fig. 10. Native LESA MS imaging of mouse liver. A) Ion image shown of m/z 3970 (16+, 64414 Da, (αβ2H)2 and the mass spectrum acquired at location (2,3) showing detection of the hemoglobin tetramer in the 15+, 16+ and 17+ charge states. B) Ion image of m/z 2039 (7+, 14264 Da, liver fatty acid binding protein (LFABP) and the mass spectrum acquired at location (2,4) showing detection of LFABP in 7+, 8+ and 9+ charge states. Reprinted from R. L. Griffiths, E. K. Sisley, A. F. Lopez-Clavijo, A. L. Simmonds, I. B. Styles, H. J. Cooper, Native mass spectrometry imaging of intact proteins and protein complexes in thin tissue sections, International Journal of Mass Spectrometry (2019), 437, 23–29 with permission under CC BY 4.0. (https://creativecommons.org/licenses/by/4.0/) (https://doi.org/10.1016/j.ijms.2017.10.009).

Fig. 10. Native LESA MS imaging of mouse liver. A) Ion image shown of m/z 3970 (16+, 64414 Da, (αβ2H)2 and the mass spectrum acquired at location (2,3) showing detection of the hemoglobin tetramer in the 15+, 16+ and 17+ charge states. B) Ion image of m/z 2039 (7+, 14264 Da, liver fatty acid binding protein (LFABP) and the mass spectrum acquired at location (2,4) showing detection of LFABP in 7+, 8+ and 9+ charge states. Reprinted from R. L. Griffiths, E. K. Sisley, A. F. Lopez-Clavijo, A. L. Simmonds, I. B. Styles, H. J. Cooper, Native mass spectrometry imaging of intact proteins and protein complexes in thin tissue sections, International Journal of Mass Spectrometry (2019), 437, 23–29 with permission under CC BY 4.0. (https://creativecommons.org/licenses/by/4.0/) (https://doi.org/10.1016/j.ijms.2017.10.009)