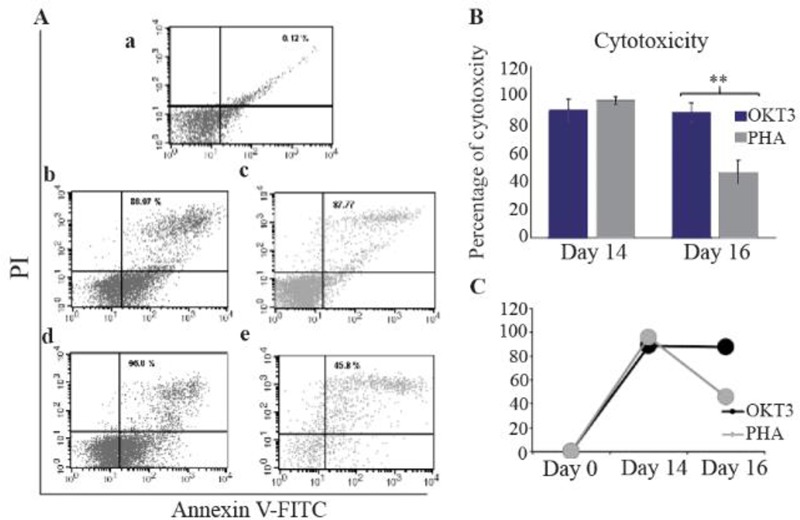
Figure 3.

Flow cytometry analysis of NK cells cytotoxicity against breast cancer cell line, MCF7, using Annexin V/PI (A). NK cell cytotoxicity on day 0 (a). NK cell cytotoxicity on day 14 and 16 in the OKT3 treated populations (b and c). NK cell cytotoxicity on day 14 and 16 in the PHA treated populations (d and e). Bare and linear charts (B and C) and show the comparison of NK cells cytotoxicity treated with OKT3 or PHA in different days. Asterisk (*) represents for p<0.05.
