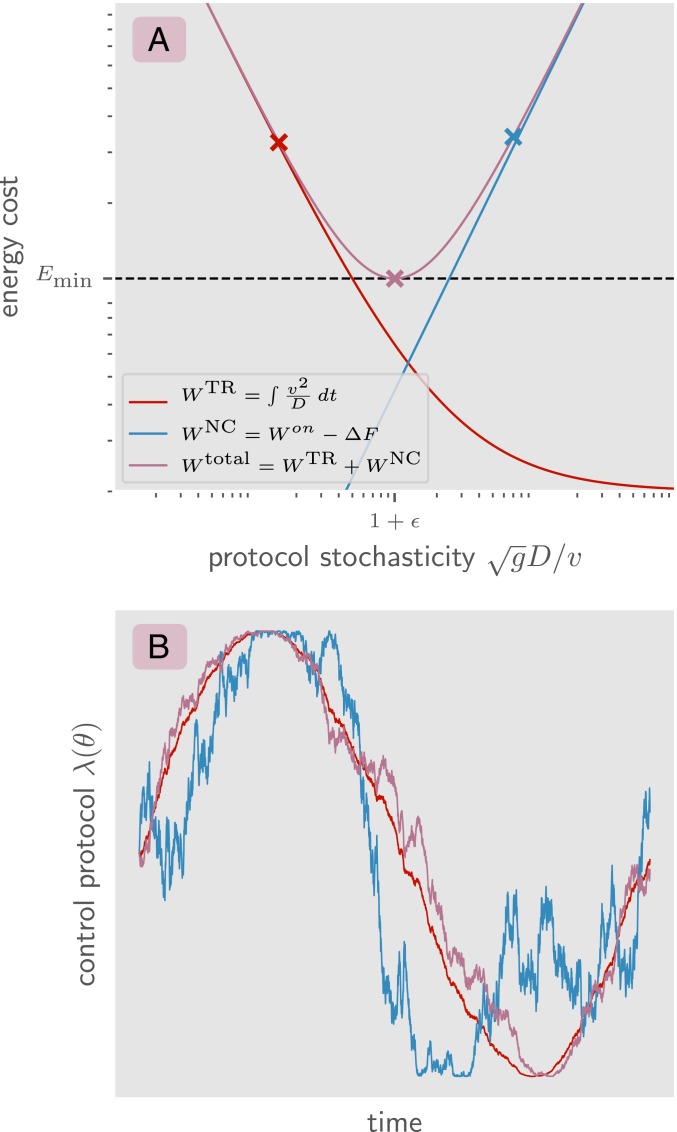
Fig. 1.
(A) The contribution to the energy dissipation from the nonconservative work done on the system (blue), the contribution from the cost of directing the control protocol in time (red), and the total energy dissipation cost (purple). On the axis is the ratio of the diffusion constant of the control protocol to the speed of the control protocol, which captures the level of stochasticity of the protocol. The marked points in A correspond to different levels of stochasticity in the control protocol. For each mark, a sample trajectory with that stochasticity is shown in B. The blue mark is a suboptimal protocol which is too stochastic, doing more work than is necessary on the system. The red mark is a suboptimal protocol which is too deterministic, spending more energy on reducing noise than is necessary. The purple mark is an optimal protocol which minimizes this energetic tradeoff by balancing these two constraints.

