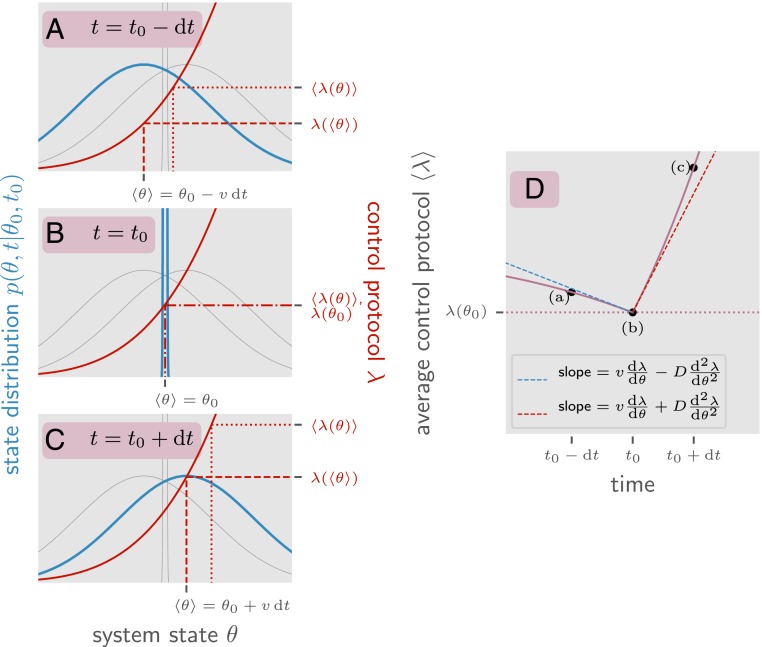
Fig. 2.
An illustration of why the time derivative of the ensemble value of is discontinuous. This system state is described by a variable with net drift and diffusion (explicitly ) and a control function . Here we look at the ensemble of all possible system trajectories such that for a fixed point . In blue is the probability of finding the system at a particular value of conditioned on the system being at at time for three different times: immediately before , at , and directly after . Since the value of at is known, is a Dirac delta function. and are identical Gaussians shifted forward and backward by . In red is the value of the control parameter as a function of . The important quantity is , the value of at a given time averaged over trajectories in . Note that while increases as a function of time (from to ) and increases as a function of , it is not the case that increases as a function of time. This is because of diffusion. Between and , the distribution of diffuses away from . Because is convex, this causes to increase. The same argument applies backward in time as well. As we move backward in time from to the distribution also diffuses away from , which in turn increases due to the convexity of . This means that the minimum value of occurs at the intermediate time . This is the origin of the discontinuity shown in . In purple is a plot of over time averaged over the same ensemble of trajectories . The time derivative has a discontinuity at related to (the convexity of ). The left- and right-sided limits of the time derivative (shown in blue and red) are the derivatives given by the Ito and reverse-Ito conventions for stochastic calculus (40).

