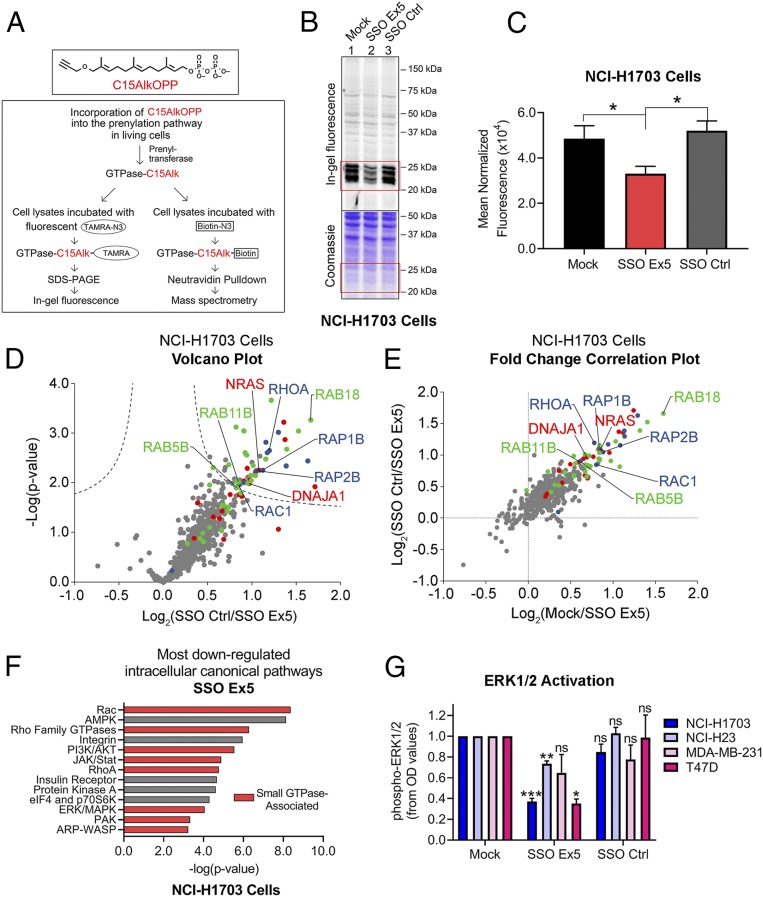
Fig. 4.
SSO Ex5 suppresses small GTPase prenylation and signaling. (A) The diagram depicts the experimental approaches used to assess SSO Ex5 effects on prenylation using the synthetic isoprenoid probe C15AlkOPP. (B) In-gel fluorescence analysis of C15AlkOPP probe incorporation (10 μM, 12 h) was conducted after NCI-H1703 cells were treated with mock, SSO Ex5, or SSO Ctrl for 72 h. (C) Coomassie-normalized fluorescence values of the 20- to 30-kDa region (highlighted in red boxes in B) for NCI-H1703 cells are shown as mean ± SEM (n = 3). Statistical significance was determined by paired, 2-tailed Student t test relative to SSO Ex5 (*P < 0.05). (D) A volcano plot was generated from quantitative proteomic analysis of C15AlkOPP-treated SSO Ctrl and SSO Ex5 NCI-H1703 samples (FDR = 0.01, s0 = 0.1). Proteins with statistically significant suppression of C15AlkOPP isoprenoid incorporation upon SSO Ex5 treatment are primarily composed of the 3 different classes of prenylation substrates: farnesylation (red), geranylgeranylation type I (blue), and Rab geranylgeranylation type II (green). Examples of significantly suppressed proteins from each substrate class are labeled, and gray dots represent nonprenylation substrates. (E) A comparison of fold changes log2(SSO Ctrl/SSO Ex5) vs. log2(mock/SSO Ex5) demonstrates similar enrichment profiles for both treatment comparisons, and indicates suppression of C15AlkOPP incorporation with SSO Ex5 compared with both mock and SSO Ctrl. (F) IPA of RNA-seq microarray data from NCI-H1703 cells treated with SSO Ex5 for 72 h identified the most down-regulated intracellular canonical signaling pathways. Red bars indicate small GTPase-associated signaling networks. (G) Densitometric analysis was conducted for activated phospho-ERK1/2 from immunoblots for the indicated cancer cell lines following treatment with mock, SSO Ex5, or SSO Ctrl for 72 h. Values were calculated by normalizing phospho-ERK1/2 and total ERK1/2 OD values to β-actin, and dividing the normalized phospho-ERK1/2 value by the normalized total ERK1/2 value. Values were then normalized to phospho-ERK1/2 in mock-treated cells, and results are presented as mean ± SEM (n ≥ 3). Statistical significance was determined by 1-way ANOVA followed by Dunnett’s multiple comparisons post hoc test relative to mock (ns, not significant; *P < 0.05, **P < 0.01, ***P < 0.001). Representative immunoblots for each cell line are shown in SI Appendix, Fig. S10.

