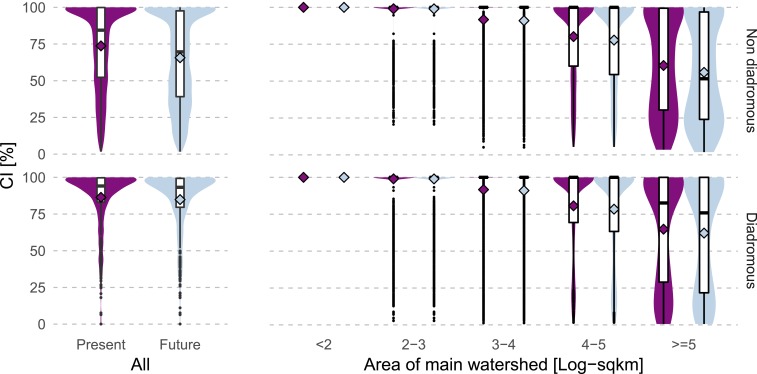
Fig. 1.
Connectivity index (CI) across species (Left) and main hydrologic basins of different size (Right) for nondiadromous (Top) and diadromous (Bottom) fish species. Values are shown for present dams (purple) as well as present and future dams together (light blue). Main hydrologic basins are defined as having an outlet to the sea or internal sink. For species occurring in multiple main basins, the area-weighted mean of the basin-specific CI values was calculated (Top). The basin-level CI (Right) represents the mean of the CI values across the species occurring within the basin. Boxes represent the interquartile range and the median, and whiskers the 95% interval. Colored violins around the boxes show the values distribution. Diamonds represent the mean.

