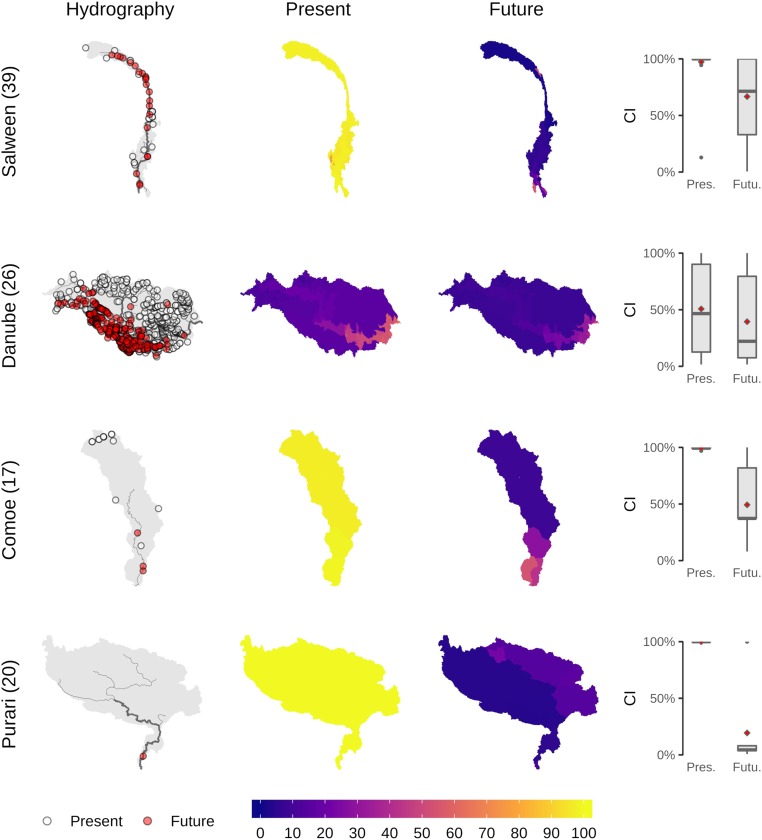
Fig. 4.
Mean connectivity index (CI in percent) across diadromous species for four exemplary main hydrologic basins. The maps show the basin hydrography with the locations of dams (Left) and the CI at the subbasin level for the present situation and future projection (Center). The species-specific CI values are summarized as boxplots, with diamonds representing the mean (Right). Numbers in brackets next to each basin name represent the number of fish species considered. Locations of the selected basins are shown in SI Appendix, Fig. S7.

