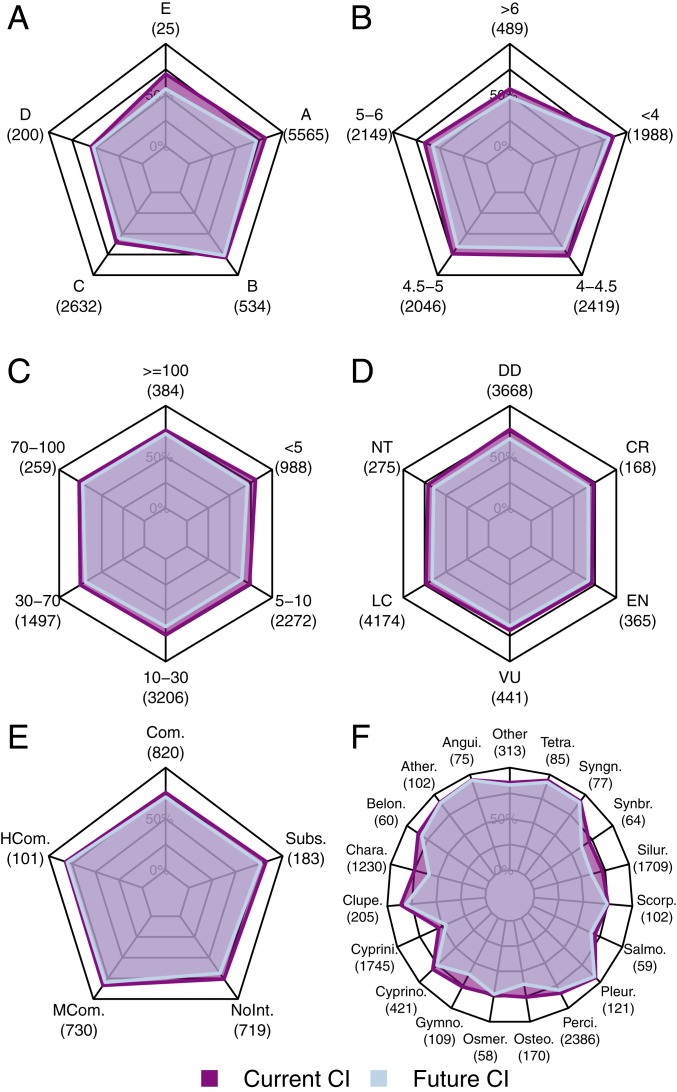
Fig. 5.
Mean of species-specific connectivity index (CI in percent) values by different traits and categories for present and future, including (A) Köppen–Geiger climate zones, where A = equatorial, B = arid, C = warm temperate, D = snow, and E = polar. (B) Geographic range area (log [base 10]-transformed square kilometers). (C) Body length (centimeters). (D) IUCN threat status, where CR = critically endangered, VU = vulnerable, NT = near threatened, LC = least concern, EN = endangered, and DD = data deficient. (E) Commercial relevance, where Com. = commercial, HCom. = highly commercial, MCom. = minor commercial, NonInt. = of no interest, and Subs. = subsistence fisheries. (F) Species order, where groups with less than 20 species are grouped together in the “other” category (the full list of order names is provided in SI Appendix, Table S2). For species occurring in multiple main hydrologic basins, an area-weighted mean of the basin-specific CI values was calculated before averaging across species. Each panel shows a subset of the analyzed 9,794 species in this study (underneath each category the number of species is reported in brackets), as metadata for species traits and categories were not available for all of the species.

