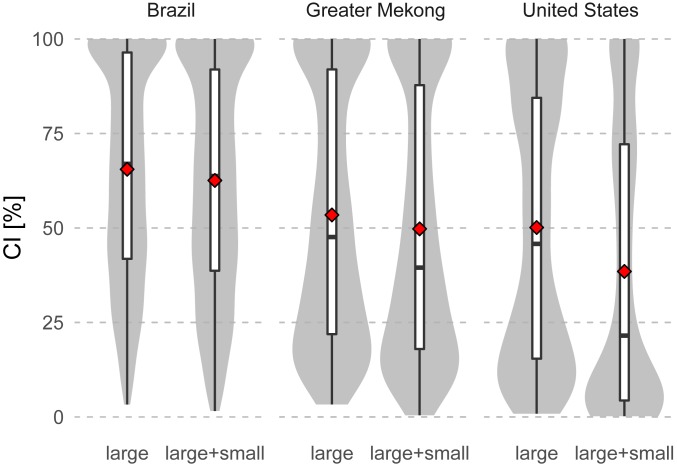
Fig. 6.
Effect of small dams on the CI values across freshwater fish species in Brazil, the greater Mekong region, and the United States. The comparison is made for each region by considering only large dams (consisting of dams employed in this study complemented with large dams [height >15 m] from national datasets; left) and by adding small dams from national datasets (right). Boxes represent the interquartile range and the median and whiskers the 95% interval. Gray areas around the boxes show the values distribution. The red diamonds represent the mean.

