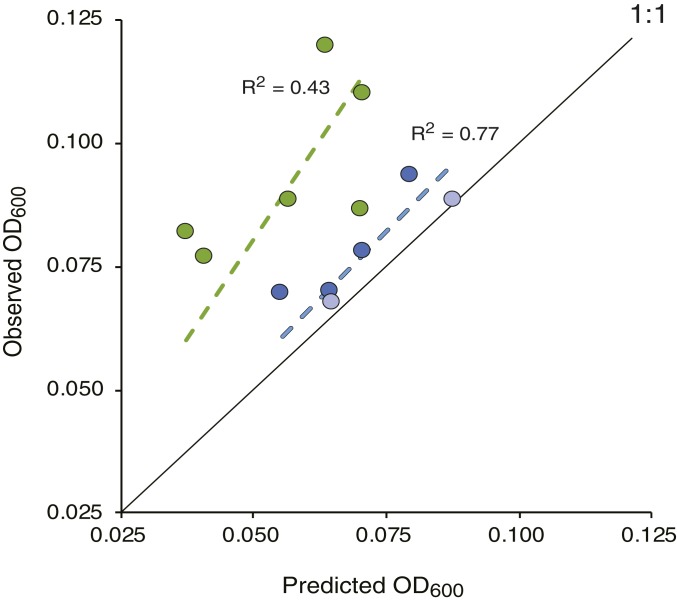
Fig. 4.
Observed versus predicted OD600 of R. pomeroyi DSS-3 after eight growth-dilution cycles in mixed-resource phycospheres. Blue symbols indicate diatom media (A1 through A6) and green symbols indicate dinoflagellate media (B1 through B6). Dotted lines, linear regression; solid line, 1:1 relationship between observed and predicted. Error bars (± 1 SE) all fall within the symbols. Light blue symbols mark the metabolite mixtures (A5 and A6) for which observed OD600 fell within the 95% CI of the predicted OD600.

