Fig. 4.
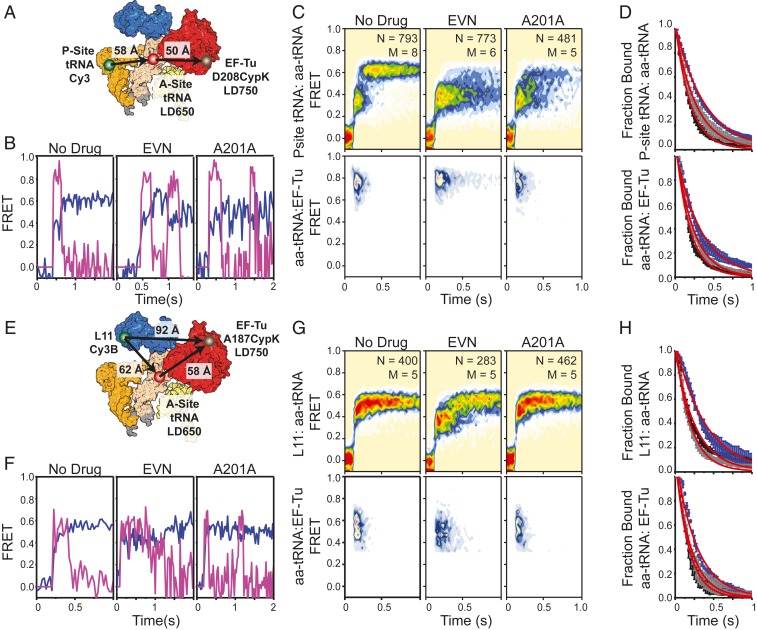
Inhibition of tRNA accommodation with antibiotics. (A) Structural diagram depicting the P-site donor-labeled FRET perspective used to determine the effects of A201A and EVN on the residence time of EF-Tu on the ribosome. smFRET trajectories (B) and population P-site(Cy3):aa-tRNA(LD650) FRET histograms (C) showing the evolution of tRNA and EF-Tu during presteady-state imaging at 5 mM Mg2+ without drug (Left), stalled with EVN (Center), or inhibited with A201A (Right) as observed at 25-ms time resolution. (D) Cumulative survivor plots for uninhibited (black), A201-inhibited (gray), and EVN-inhibited (blue) complexes. (E) Structural diagram of the L11 donor-labeled FRET perspective. smFRET trajectories (F) and population L11(Cy3B):aa-tRNA(LD650) FRET histograms (G) showing the evolution of tRNA and EF-Tu in during presteady-state imaging without drug (Left), stalled with EVN (Center), or inhibited with A201A (Right). (H) Cumulative survivor plots for uninhibited (black), A201-inhibited (gray), and EVN-inhibited (blue) complexes.

