Fig. 5.
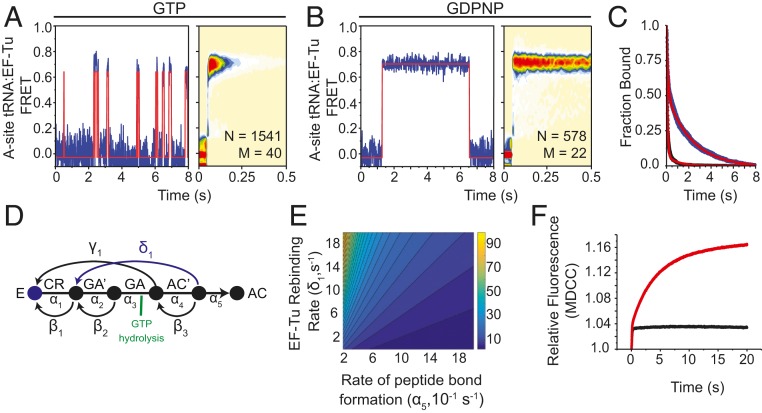
EF-Tu rebinds stalled ribosomes. Representative smFRET trajectories (Left) and tRNA(Cy3B):EF-Tu(LD650) FRET histograms (Right) observed at 10-ms time resolution when (A) EF-Tu⋅GTP or (B) EF-Tu⋅GDPNP is stopped-flow–delivered with 5 mM Mg2+ to A-site–filled ribosomal complexes stalled by 20 µM hygromycin A. smFRET traces were idealized using a hidden Markov model with two states (orange line). (C) Survival plot showing the ensemble lifetime of interactions between stalled ribosomal complexes and either EF-Tu⋅GTP (black line) or EF-Tu⋅GDPNP (blue line). Each condition was fit to a two-term exponential decay model (red line). (D) Markov model of tRNA selection composed of forward (α) and backward (β) elemental rate constants with the proposed EF-Tu rebinding pathway (blue). (E) Contour plot illustrating the relationship between the rates of peptide bond formation, EF-Tu rebinding, and the number of GTP molecules hydrolyzed (z axis). (F) Pi release in tRNA selection without drug (black trace) and with 20 µM hygromycin A (red trace).

