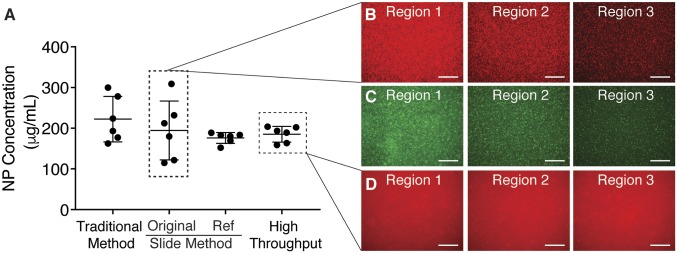
Fig. 5.
A comparison of nanoparticle concentration using previous methods shows similar concentration with reduced deviation. (A) Circulation half-life measurement at a single time point (4 h) after IV administration of PLA-PEG nanoparticles using the traditional method to dissolve nanoparticles, the initial improved protocol moving to quantitative microscopy, and the high-throughput method described here (n = 6 images per group). Error bars represent SD. Images obtained through these techniques demonstrate the variation between regions imaged using a microscope slide (B and C) and the consistency obtained using a glass-bottom plate (D). (Scale bars, 100 µm.)

