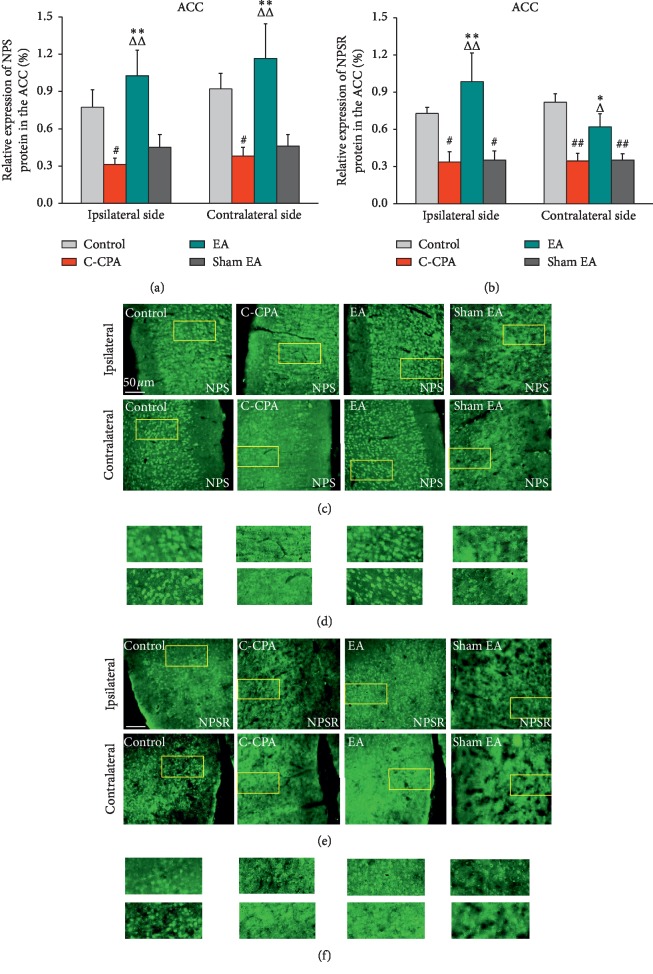
Figure 5.
(a) Relative expression of NPS protein (%) in the ACC after EA stimulation in each group. (c) Representative micrographs of bilateral sides (ipsilateral side for the left side and contralateral side for the right side). (b) Relative expression of NPSR protein (%) in the ACC after EA stimulation in each group. (e) Representative micrographs of bilateral sides (ipsilateral side for the left side and contralateral side for the right side). (d, f) High-magnification image of the areas indicated by the yellow squares in (c) and (e). Five rats in each group. #P < 0.05 and ##P < 0.01, C-CPA and sham EA vs. control; ΔP < 0.05 and ΔΔP < 0.01, EA vs. C-CPA; ∗P < 0.05 and ∗∗P < 0.01, EA vs. sham EA.

