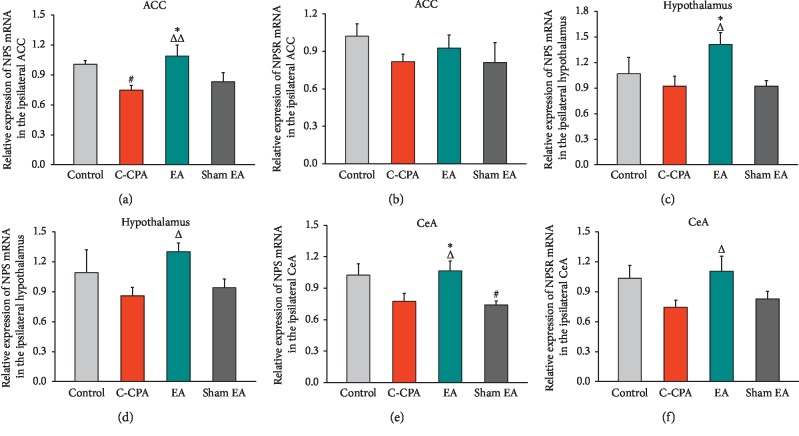
Figure 8.
Relative expression of (a) NPS mRNA and (b) NPSR mRNA in the ipsilateral ACC after EA stimulation in each group; (c) NPS mRNA and (d) NPSR mRNA in the ipsilateral hypothalamus after EA stimulation in each group; and (e) NPS mRNA and (f) NPSR mRNA in the ipsilateral CeA after EA stimulation in each group. Five rats in each group. #P < 0.05, C-CPA and sham EA vs. control; ΔP < 0.05 and ΔΔP < 0.01, EA vs. C-CPA; ∗P < 0.05, EA vs. sham EA.

