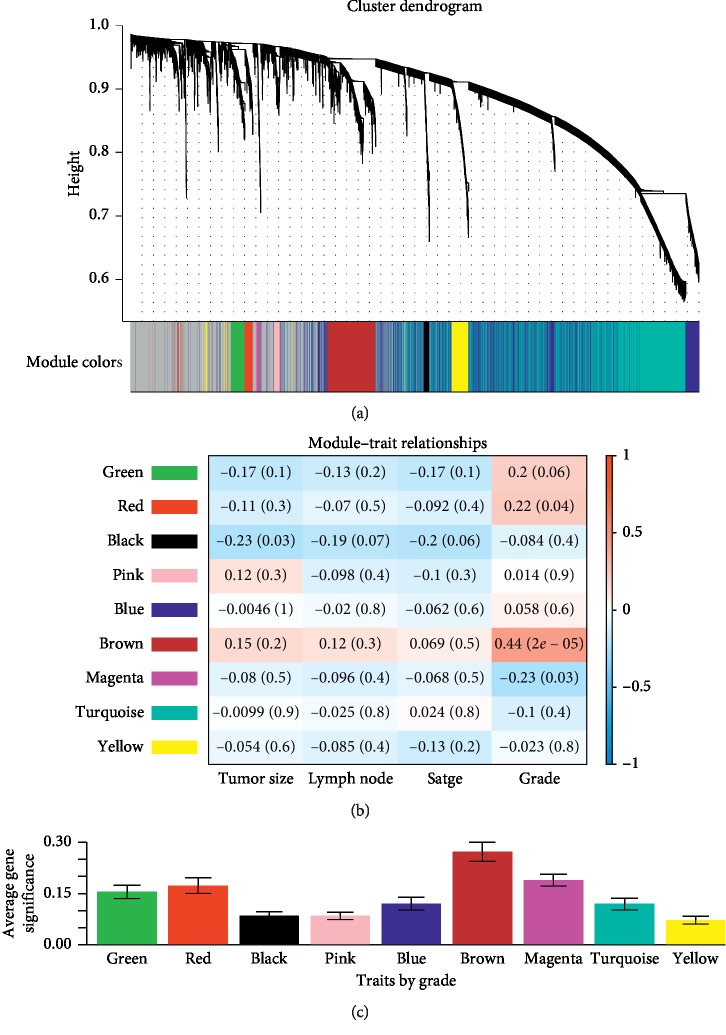
Figure 4.
Identifying LUAD-associated clinical significant modules. (a) The dendrogram of top 50% most variant genes which were clustered by the Dynamic Tree Cut algorithm. (b) The heat map describing the correlation between all module eigengenes and clinical traits including tumor size, lymph node metastasis, TNM stage, and tumor differentiation grade. (c) The histogram describing the relationship between the average gene significance of all modules and tumor differentiation grade.

