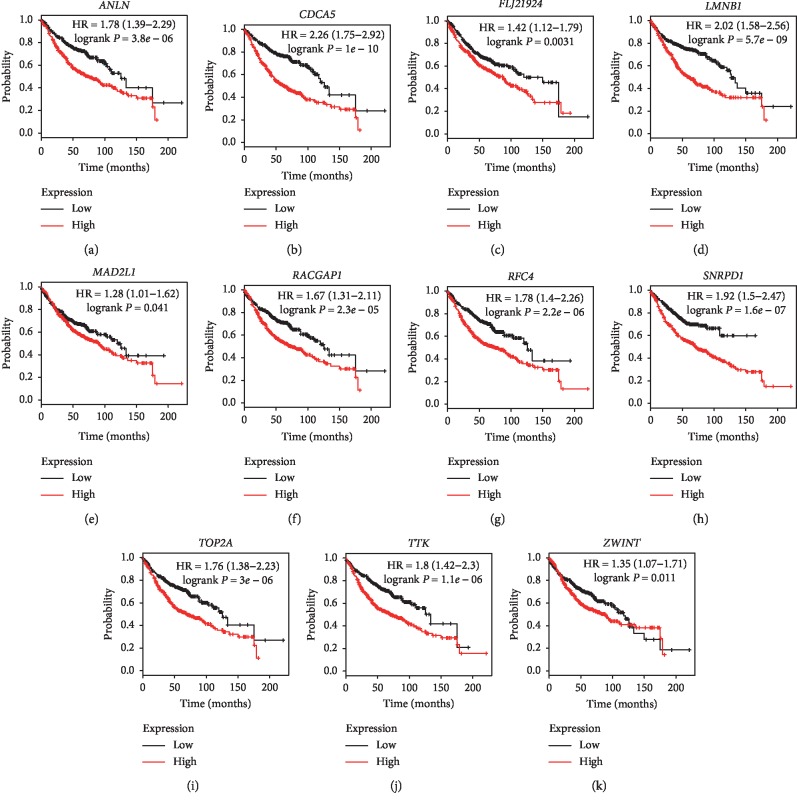
Figure 8.
Overall survival analysis of the 11 hub genes in LUADs by online tool Kaplan–Meier plotter. The patients were classified into high-expression group and low-expression group based on the median mRNA levels of (a) ANLN, (b) CDCA5, (c) FLJ21924, (d) LMNB1, (e) MAD2L1, (f) RACGAP1, (g) RFC4, (h) SNRPD1, (i) TOP2A, (j) TTK, and (k) ZWINT.

