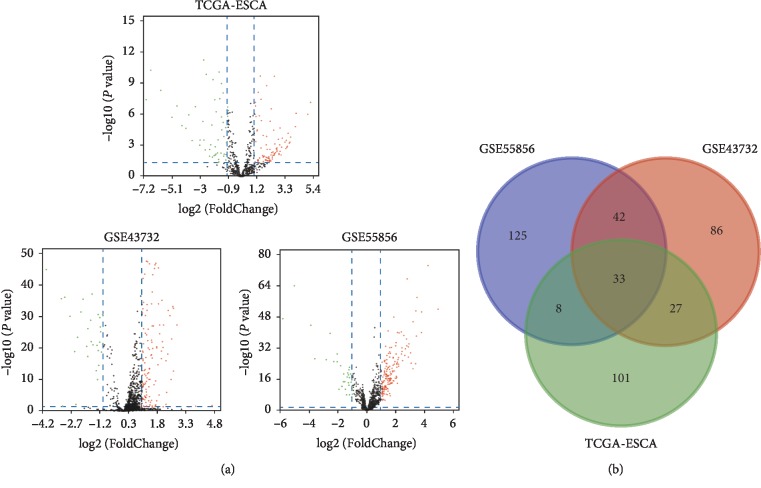
Figure 1.
Identification of DEGs among TCGA and GEO datasets of ESCA. (a) Volcano plot of miRNA expression profile data between ESCA tissues and normal tissues in each dataset. Red dots: significantly upregulated genes in ESCA; Green dots: significantly downregulated miRNAs in ESCA; Black dots: nondifferentially expressed miRNAs. P < 0.05 and |log2 FC| > 1.0 were considered as significant. (b) The Venn diagram showing the overlapped miRNAs in three datasets. ESCA and esophageal carcinoma.

