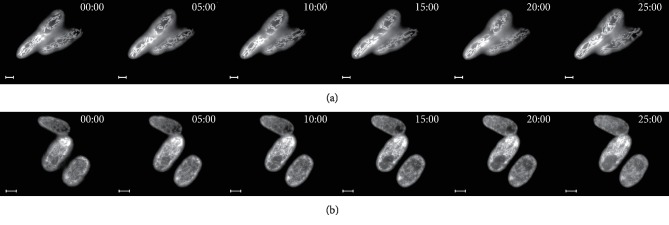
Figure 10.
Time-lapse microscopy of D. magnusii cells. Exponentially grown yeast cells were used. For visualization of mitochondria, cells were rinsed with 50 mM PBS, pH 5.5, and then incubated with 200 nM MitoTracker Green for 30 min. (a) Control; cells were imaged for 25 min with a 30 s time interval. The full video is presented in Video 1 in the Supplementary Material. (b) Cells were incubated with 45 μM BAC; cells were imaged for 25 min with a 30 s time interval. The full video is presented in Video 2 in the Supplementary Material. Scale bars are 10 μm.

