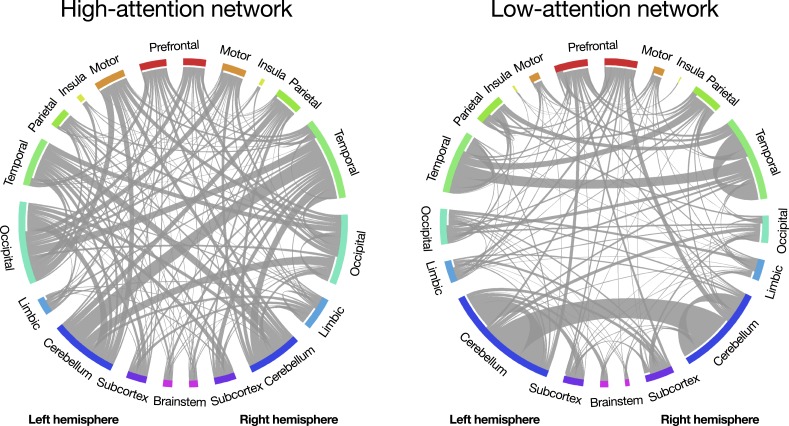
Fig. 2.
Functional connections (edges) in the high-attention and low-attention networks (33). Network nodes are grouped into macroscale brain regions; lines between them represent edges. Line width corresponds to the number of edges between region pairs. Created using Circos (43). Adapted with permission from ref. 44.

