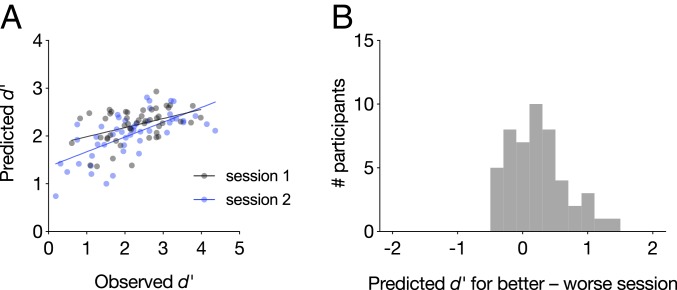
Fig. 3.
(A) The sustained attention CPM generalized to predict gradCPT performance during two neuroimaging sessions. Each participant is represented with one gray dot corresponding to session 1 performance and one blue dot corresponding to session 2 performance. (B) Difference in predicted performance for each person’s better and worse task sessions. Values greater than zero indicate that the model correctly predicted a higher score for the better session.

