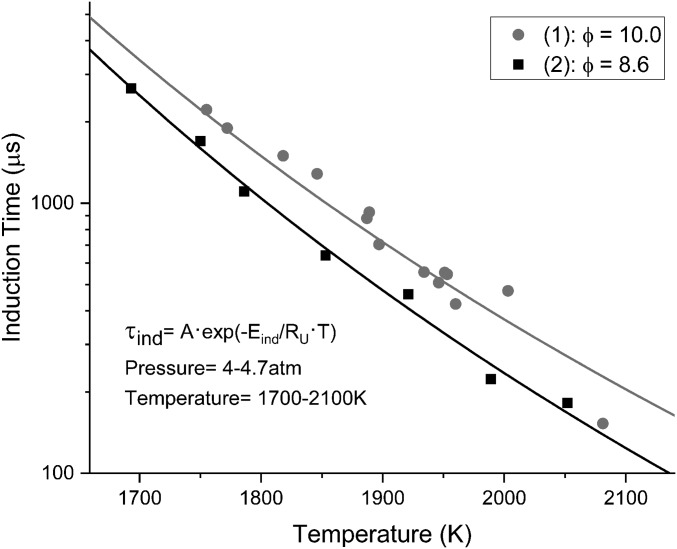
Fig. 3.
The experimental induction times for mixtures (1) and (2) are shown. The carbon content of these mixtures is the same with the only difference being the oxygen content (equivalence ratio). The pressure ranges are within the same range (SI Appendix).

