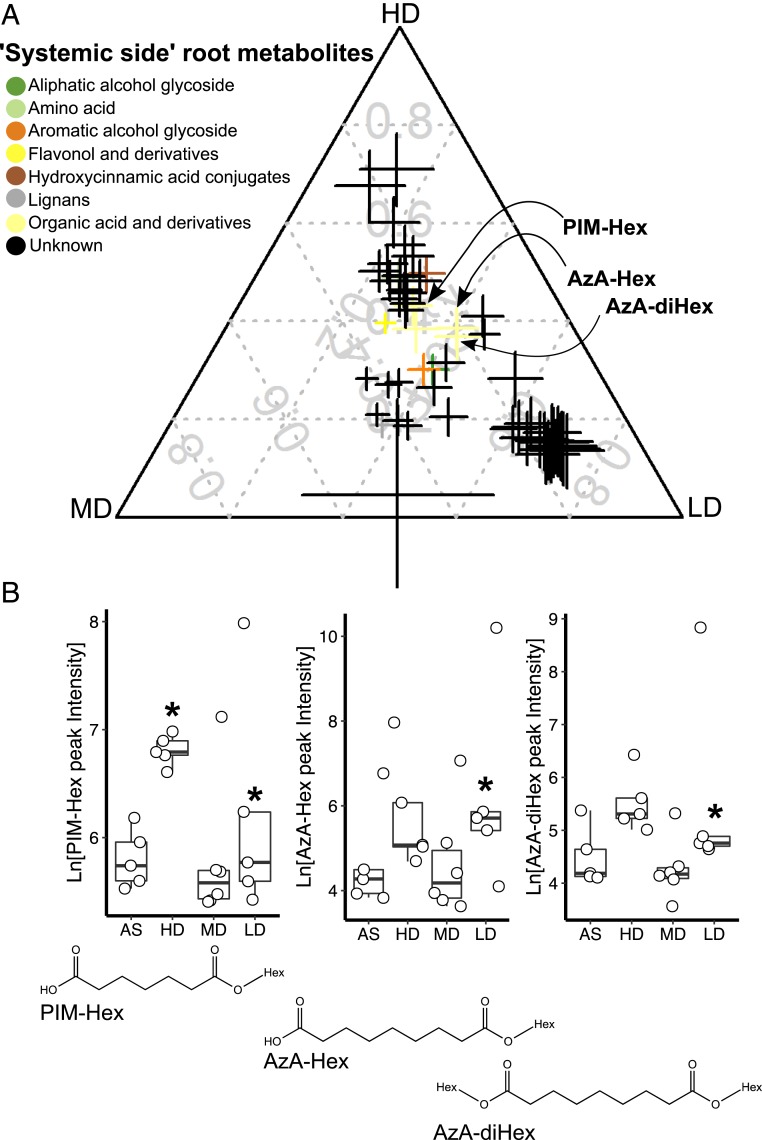
Fig. 3.
Glycosylated forms of azelaic and pimelic acids accumulate in the systemic root side upon SIREM induction. (A) Ternary plot of metabolites differentially enriched in the systemic-side root tissue of HD-, MD-, or LD-treated plants as compared to AS-control plants. Each data point represents a metabolite enriched in the systemic-side root associated with a microbiome treatment in the local-side root (n = 5 to 6, FDR <0.05, fold change >2). Data point size denotes the sum of fold change (square root transformed) of one metabolite in HD-, MD-, or LD-treated samples as compared to the AS controls. Data point position indicates the percent of each metabolite present in each group (i.e., HD, MD, LD). Color codes represent the metabolite chemical class. Data points of azelaic acid dihexose (AzA-(di)Hex) and pimelic acid hexose (PIM-Hex) are highlighted. The metabolite annotation data and the numerical values used to construct the ternary plot can be found in Dataset S2 A and E, respectively. (B) Root microbiome induced of the accumulation of azelaic and pimelic acids glycosides in systemic-side roots. AzA-(di)Hex and PIM-Hex peak intensities (natural log transformed) are represented in boxplots. Asterisks above boxes indicate significant difference tested by ANOVA performed with Tukey’s HSD test (n = 5 to 6, FDR <0.05). Structures of AzA-(di)Hex and PIM-Hex are depicted below the corresponding boxplots.

