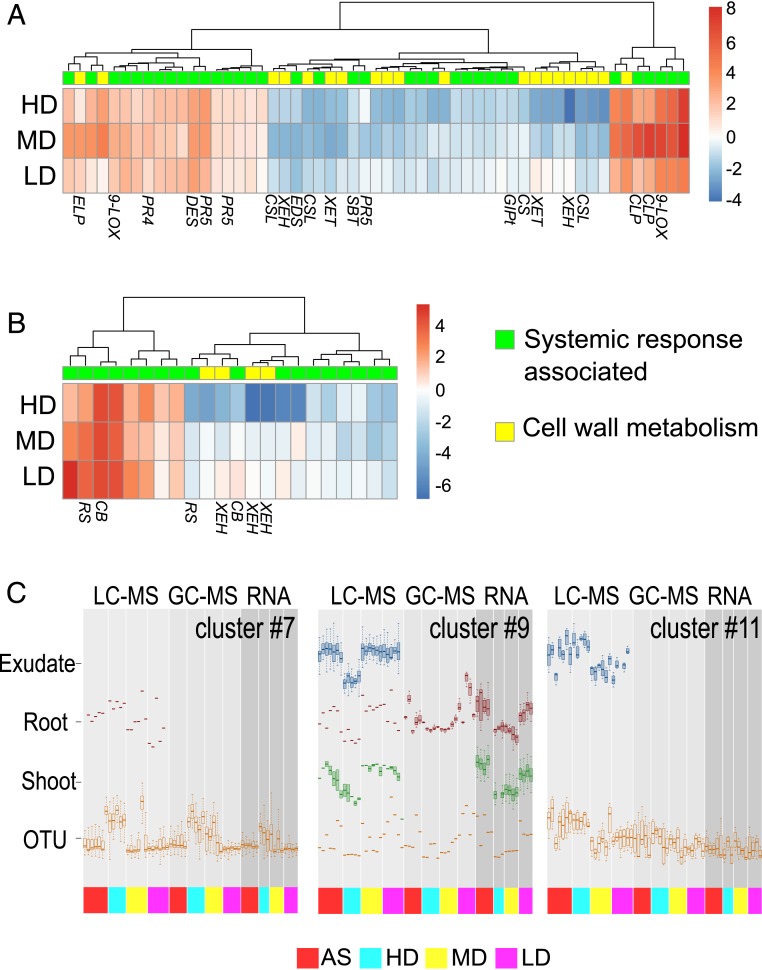
Fig. 5.
Integration of SIREM-associated data. Heat maps representing the expression of known systemic response-associated genes (green) and those related to cell wall biosynthesis (yellow) expressed in (A) shoots and (B) roots significantly regulated by local-side root microbiome. Induced (red to white) and repressed (white to blue) genes are depicted as log2 (fold changes) relative to plants AS treated. 9-LOX, 9-lipoxygenase; CLP, chitinase; CSL, cellulose synthase-like protein; XEH, xyloglucan endotransglucosylase-hydrolase; XET, xyloglucan endo-transglycosylase; CS, cellulose synthase; GlPt, glycerol-3-phosphate transporter; PR5, pathogen-induced protein 5; SBT, subtilisin-like protease; EDS, enhanced disease resistance-like protein; DES, divinyl ether synthase; PR4, pathogen-induced protein 4; ELP, extensin-like protein; CB, calcium-binding protein; RS, riboflavin biosynthesis protein. The gene annotations and numerical values can be found in Dataset S4 B and E. (C) Selected SOM clusters representing integrated data (i.e., microbiome, transcriptomics, and metabolomics). The dataset was filtered to include variables exhibiting significant root microbiome effects (ANOVA P value ≤0.05). Boxplots for the variables mapped to three SOM clusters. The OTU accumulation in these clusters was enriched in a specific bacterial group; clusters 7 and 11 accumulated OTUs related to Pseudomonadales, while cluster 9 accumulated one OTU related to Bacillales. The complete set of SOM clusters can be found in SI Appendix, Fig. S15 and the SOM classification of integrated data can be found in Dataset S5.

