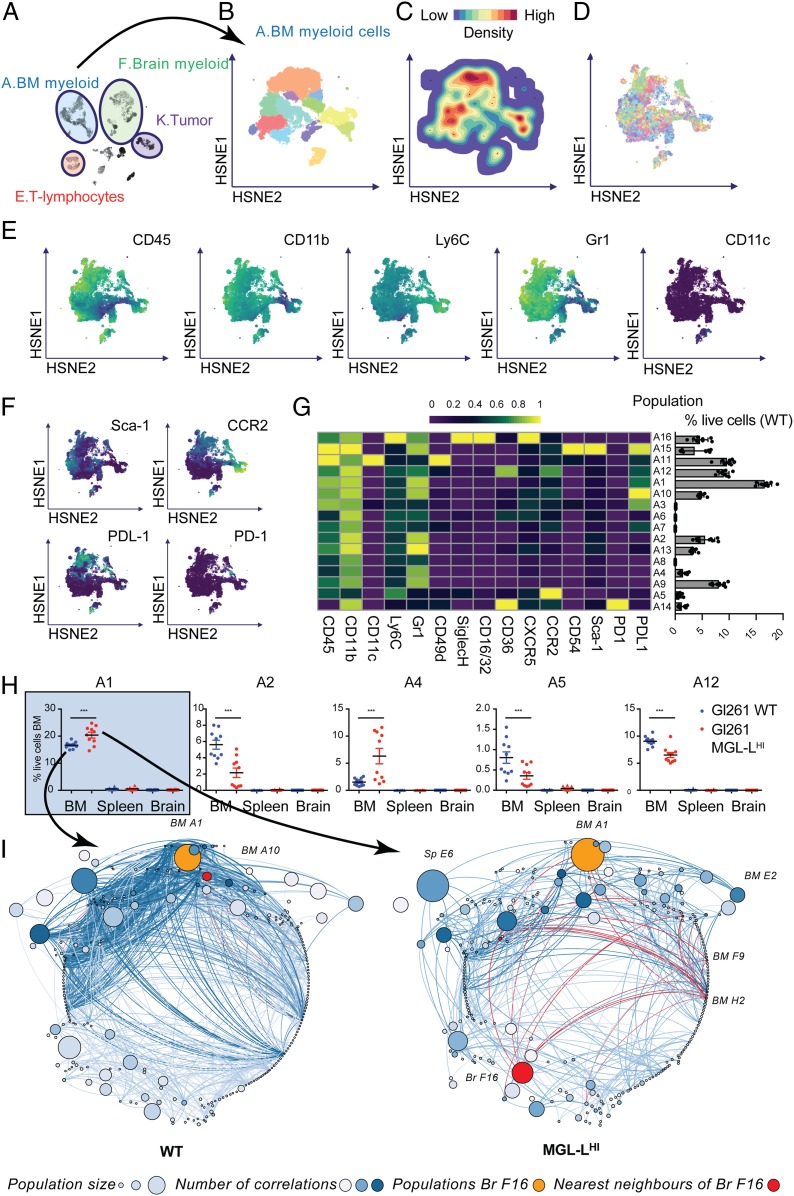
Fig. 5.
Glioblastoma-associated MGL-Ls affect the myeloid composition of the BM. (A) HSNE map with the main clusters of interest highlighted. (B) HSNE map, colored by cluster as identified in the second-level HSNE clustering of cluster A: BM-derived myeloid cells. (C) Cell density. (D) Sample distribution. (E) HSNE maps representing relative expression of the classifying myeloid markers. (F) HSNE maps representing relative expression of functional markers. (G) Heatmap with relative Arcsinh transformed expression of shown markers in the second-level HSNE of population A (Left) with a bar graph showing the percentages of total live cells in the BM that the subclusters contain (Right). (H) The five subpopulations with statistically significant differences in relative frequency between mock transfected tumors and Cosmc KO tumors. (I) Networks of subclusters from WT (Left) and MGL-LHi (Right) tumors with nodes representing all of the subclusters in the experiment and edges representing correlation coefficients for relationships between the subclusters. The size of the nodes represents the size of the population, the color intensity of the nodes represents the degree (number of connections to other nodes), and the color intensity of the edges represents the correlation coefficient. The orange nodes highlight population A1, and the red nodes highlight the nearest neighbors of population A1 in both WT and Cosmc KO tumors. ***P < 0.001.

