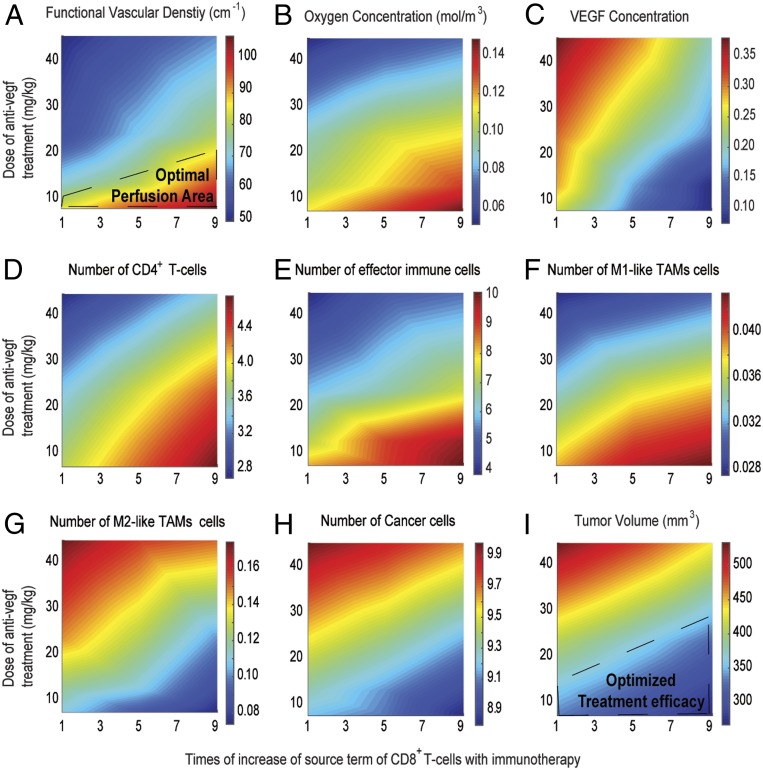
Fig. 4.
Effect of different doses of anti-VEGF treatment combined with different values of the source term of CD8+ T cells to model immunotherapy for sequential administration. Shown are phase diagrams for the effect of combinatorial treatment on functional vascular density (A), tumor oxygenation (B), VEGF level (C), CD4+ T cells (D), effector immune cells (NK and CD8+ T cells) (E) , M1-like (F) and M2-like (G) TAMs, cancer cell population (H), and tumor volume (I). Values of model parameters presented in the figure were calculated at the location equidistant from the tumor center and periphery. On the x-axis, a value of 1 corresponds to the baseline value of source term of CD8+ T cells (SI Appendix, Table S1).

