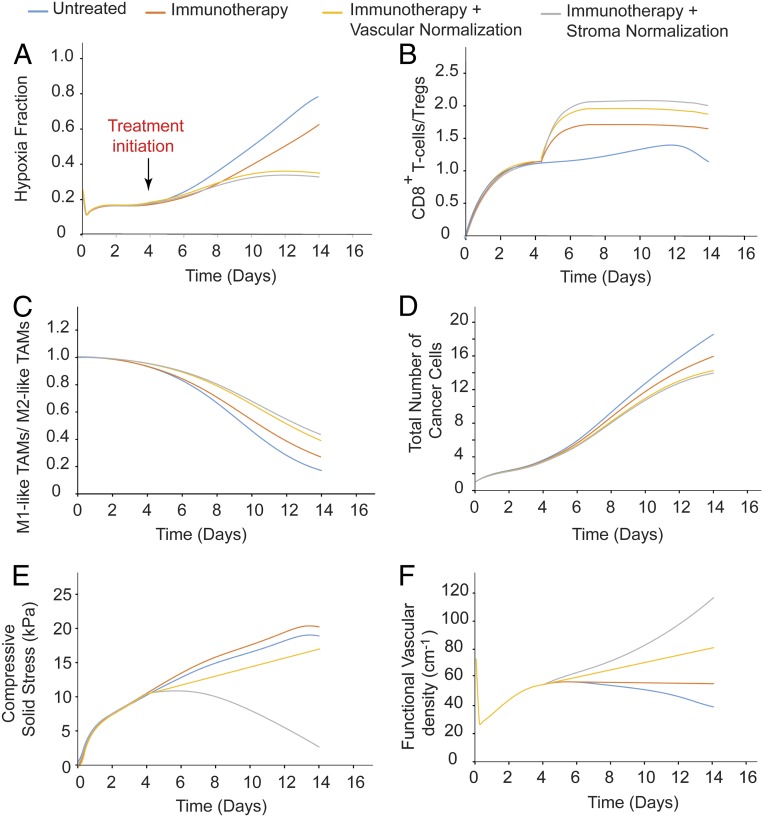
Fig. 5.
Temporal distribution of the values of model parameters: hypoxia fraction (A), ratio of CD8+ T cells to Tregs (B), ratio of M1-like to M2-like TAMs (C), cancer cell population (D), solid stress (E) and functional vascular density (F), calculated at the center of the tumor for untreated tumors and tumors receiving immunotherapy alone or combined with a normalization treatment.

