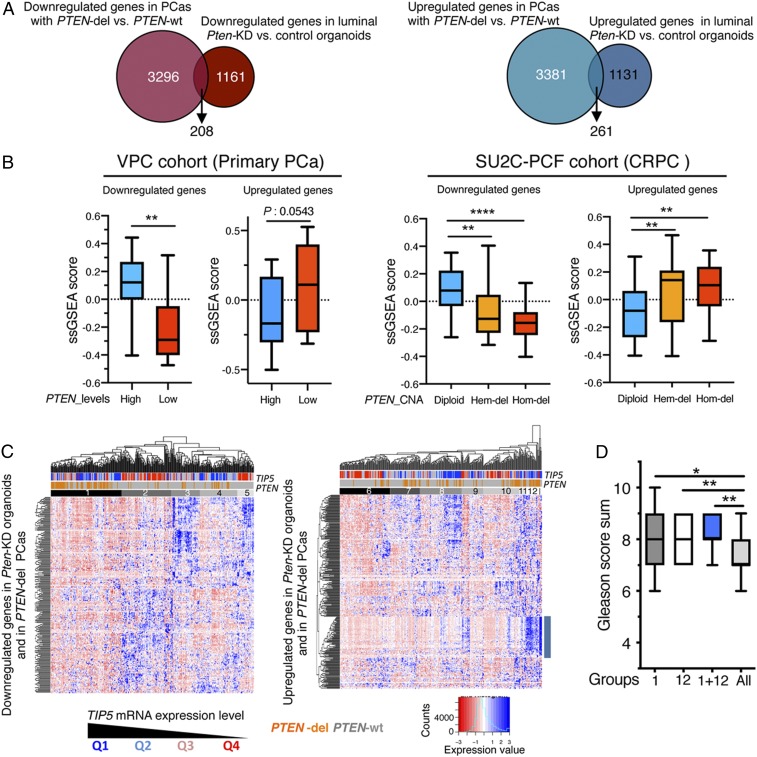
Fig. 6.
Expression of PTEN-regulated genes in primary PCa correlates with TIP5 levels. (A) Proportional Venn diagrams showing the number of genes that are differentially expressed in both PTEN-del PCas and Pten-KD organoids of luminal origin. (B) Single sample gene set enrichment analysis scores in primary PCa (VPC, n = 43) and CRPC (SU2C, n = 93) datasets of genes found differentially expressed in both PTEN-del PCas using the TCGA–PRAD dataset and Pten-KD organoids of luminal origin. In the analysis of the VPC dataset, measurements referred to the top 25% of PCa with the higher PTEN expression (High) and the top 25% of PCas with the lowest PTEN levels (Low). In the analysis of the SU2C dataset, measurements referred to groups of tumors with PTEN status as diploid, hemizygous (Hem-del), or homozygous (Hom-del) deletion. Statistical significance (P values) was calculated using the unpaired two-tailed t test (*< 0.05; ** <0.01; *** <0.001; **** <0.0001). (C) Unsupervised hierarchical clustering and heatmaps illustrating the expression of genes that are down-regulated or up-regulated in both PTEN-del PCas and Pten-KD organoids of luminal origin in primary PCas. The row dendrogam represents gene clusters. The column dendogram separates tumors into clusters according to gene expression. Normalized gene expression is indicated by the row Z-score value. (D) Gleason score of groups 1 and 12 and PCas common to both groups. Statistical significance (P values) was calculated using the paired two-tailed t test (*< 0.05; ** <0.01).

