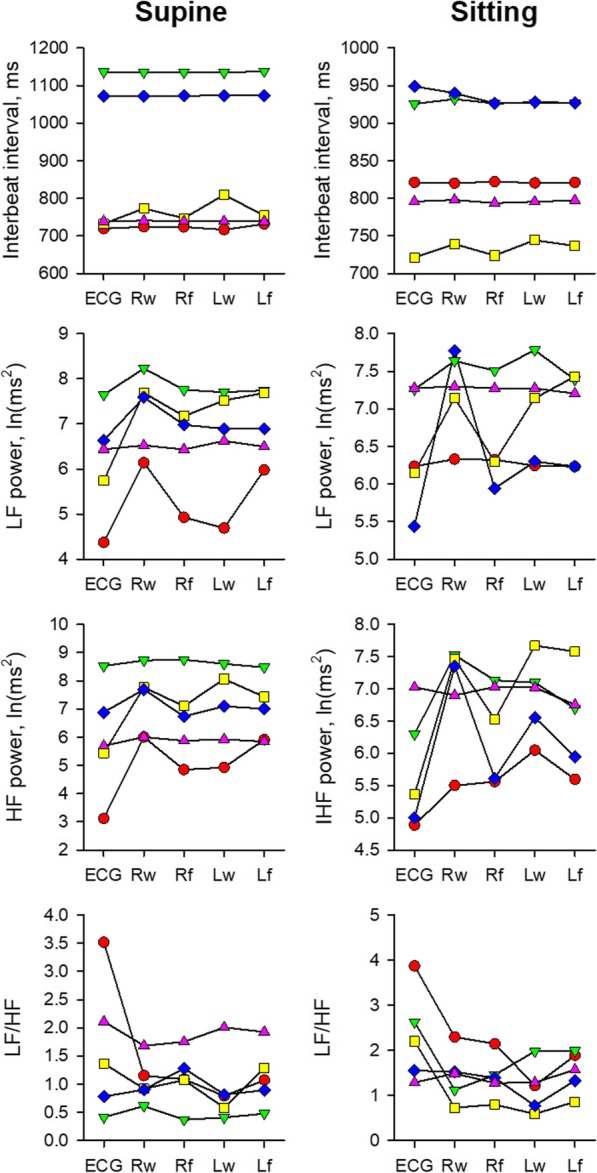
Fig. 1.

Mean interbeat intervals and variability measures of ECG R-R and pulse intervals at four different sites in five subjects. Different colors present different subjects and data of each individual subject are connected by lines for visibility. HF high-frequency component, LF low-frequency component, Lf left forearm, Lw left wrist, Rf right forearm, Rw right wrist
