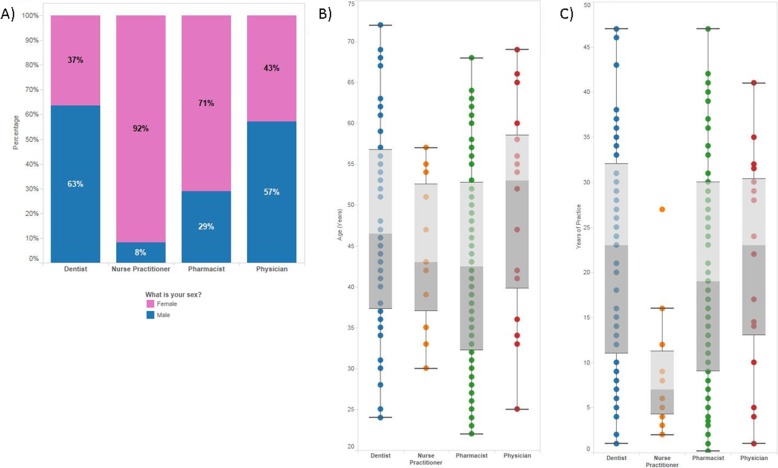
Fig. 1.
Health care provider demographics. a Percentage of respondents who identified as male or female in each health care provider category. b Box plot indicating the age of respondents in each health care provider category. c Box plot indicating the years of practice of respondents in each health care provider category

