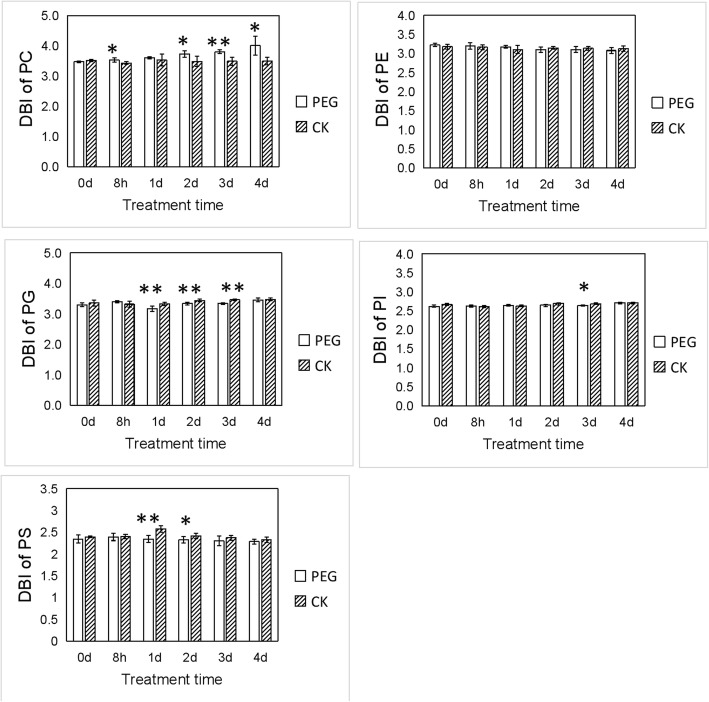
Fig. 5.
Changes in the DBI of phospholipids with water stress time. DBI = Σ(n × mol% lipid)/100, where n is the total number of double bonds in the two fatty acid chains of each glycerolpid molecule. * and ** indicate significant differences between plants under treatment with PEG (PEG) and without PEG (CK) at the same time points of determination at P < 0.05 and P < 0.01 respectively. Values are means ± SE (n = 4 to 6)

