Fig. 6.

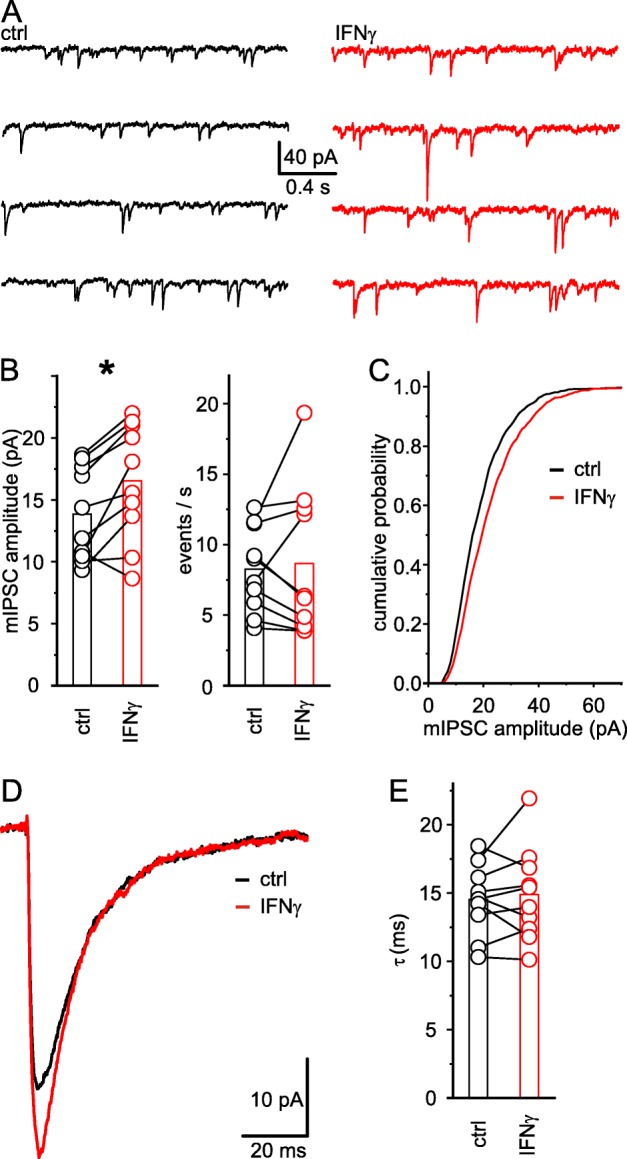
IFN-γ increases mIPSC amplitudes in neocortical layer 5 neurons. a Example traces of mIPSCs recorded in the presence of CNQX, DAP5, and TTX before (black) and upon application of IFN-γ (1000 IU ml−1; 20 min; red). b Mean mIPSC amplitudes (left) increased upon application of IFN-γ, while mIPSC frequency (right) remained unaltered. c Cumulative relative frequency graph of mIPSC amplitudes for an example neuron shows an increase in amplitudes after application of IFN-γ (red) in comparison to the initial state (black). d Example trace of a single mIPSC before (black) and upon application of IFN-γ (red). e IFN-γ did not influence mIPSC decay time. Rs remained constant (Rs-ctrl 14.1 ± 0.7 MΩ vs. Rs-IFN-γ 14.5 ± 0.8 MΩ; n = 10; P = 0.55, paired t test) throughout the experiments. Average rat age P16.1 ± 1.9
