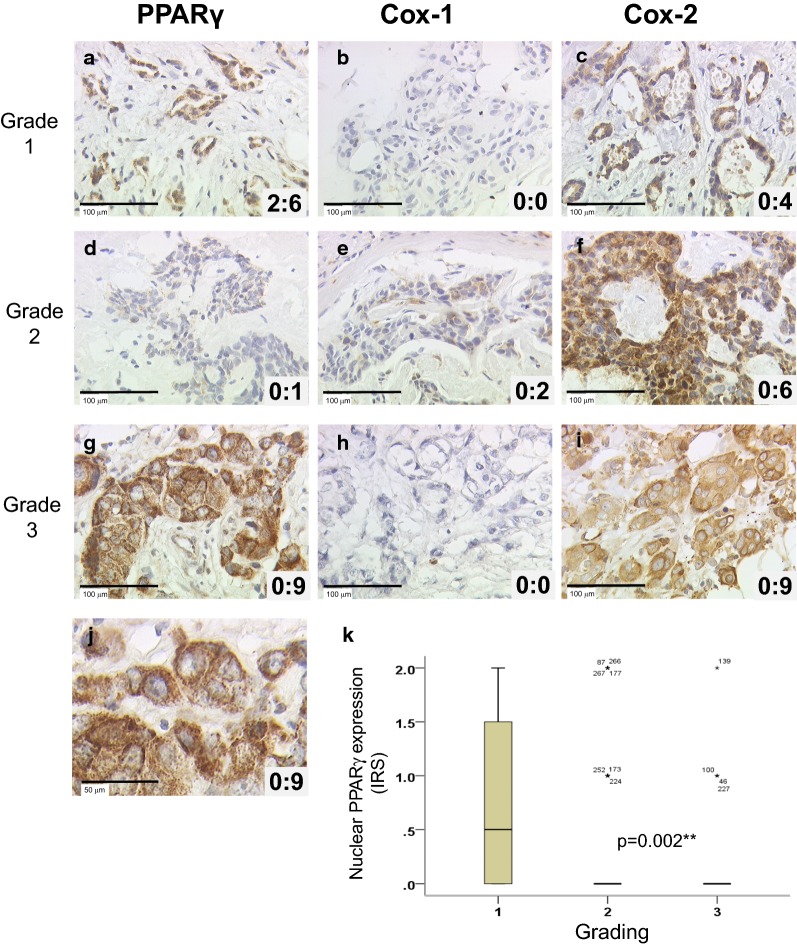
Fig. 1.
Immunohistochemical stainings of PPARγ, Cox-1 and Cox-2 expression in breast carcinoma of 3 patients and a box-plot of nuclear PPARγ and Grading. PPARγ (a, d, g), Cox-1 (b, e, h) and Cox-2 (c, f, i) stainings are illustrated for patients with different grading (Grade 1 in a–c, 2 in d–f and 3 in g–i), with examples of null, average or high expressions. Nucleo:cytoplasmic IRS ratios are indicated in each photomicrograph (×25 magnification) and scale bar equals 100 μm. An enlargement of g (high cytoplasmic and null nuclear PPARγ staining) is presented (j) and scale bar equals 50 μm. Correlation between nuclear PPARγ and grading was presented as box plot (k). The boxes represent the range between the 25th and 75th percentiles with a horizontal line at the median. The bars on top and below depict the 5th and 95th percentiles. Values more than 1.5 box lengths from the 75th percentile are indicated by circles (none) and values more than 3.0 box lengths from the 75th percentile are indicated by asterisks. The numbers on asterisks represent the case number. Statistical significance is shown as p-value from Kruskal–Wallis test (**p < 0.01)

