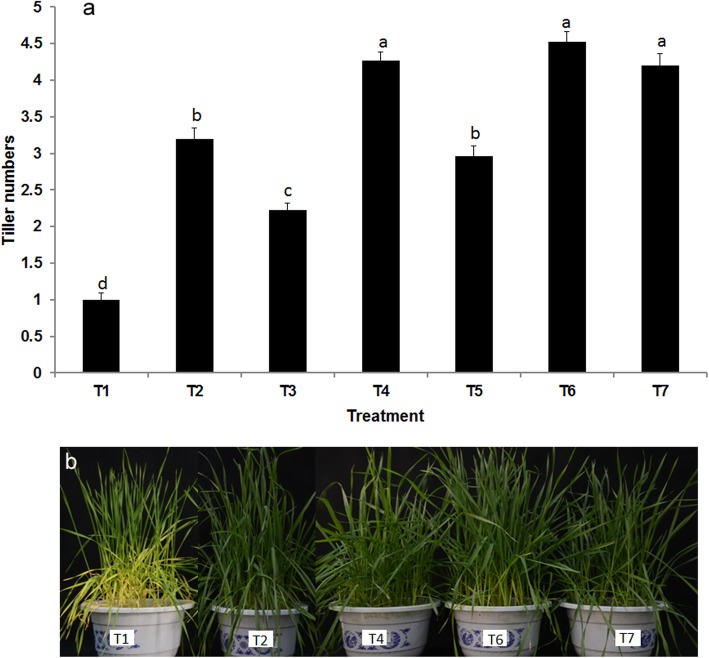
Fig. 5.
a The effect of bacterial combination K14 + 176 + P9 + N8 + P5 and fertilizer application on tiller number of potted wheat. Values are means ± SE. abcd letters on the bars denote differences on the basis of a t-test (p < 0.05). b Phenotype of wheat under different fertilization treatments. T1: without fertilizer, T2: PGPR combination 6, T3: 50% fertilizer, T4: 50% fertilizer + PGPR combination 6, T5: 75% fertilizer, T6: 75% fertilizer + PGPR combination 6, T7: 100% fertilizer

