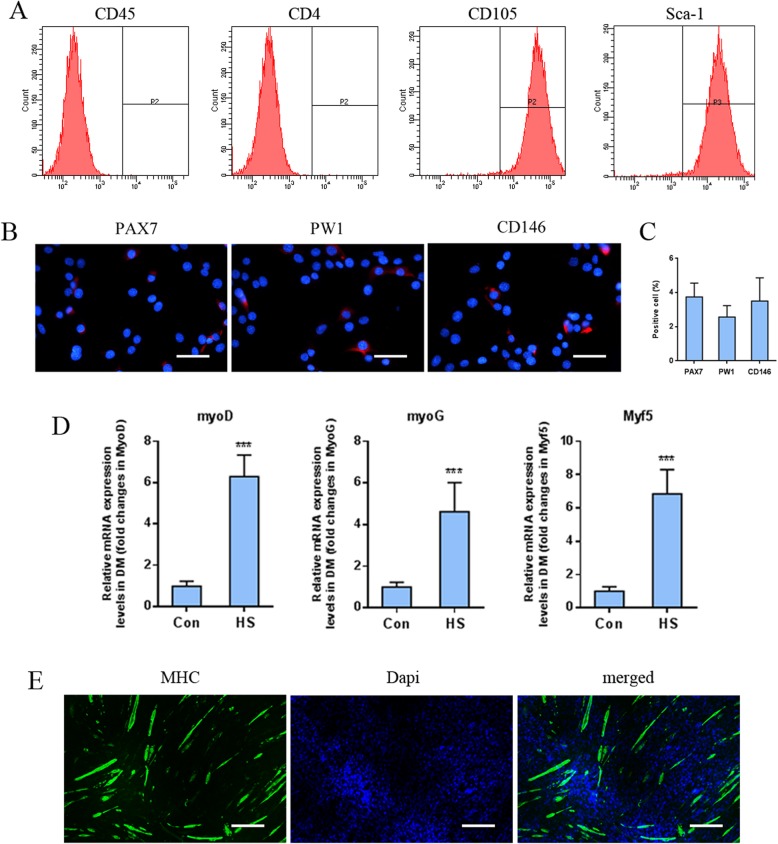
Fig. 1.
a Flow cytometry of the cellular surface markers of CD45, CD4, CD105, and Sca-1 in MDSCs. b Cellular immunochemistry analysis of satellite cell marker PAX7, pericyte marker PW1, and interstitial progenitor cell marker CD146 expression in MDSCs, scale bar: 50 μm. c Positive cell rate calculation based on fluorescent imaging. d qPCR analysis of the myogenic marker expression in MDSCs under myogenic induction on day 3. e Cellular immunochemistry image of MHC expression (green) in MDSCs and nuclei stained with Dapi (blue), scale bar 200 μm. ***P < 0.001

