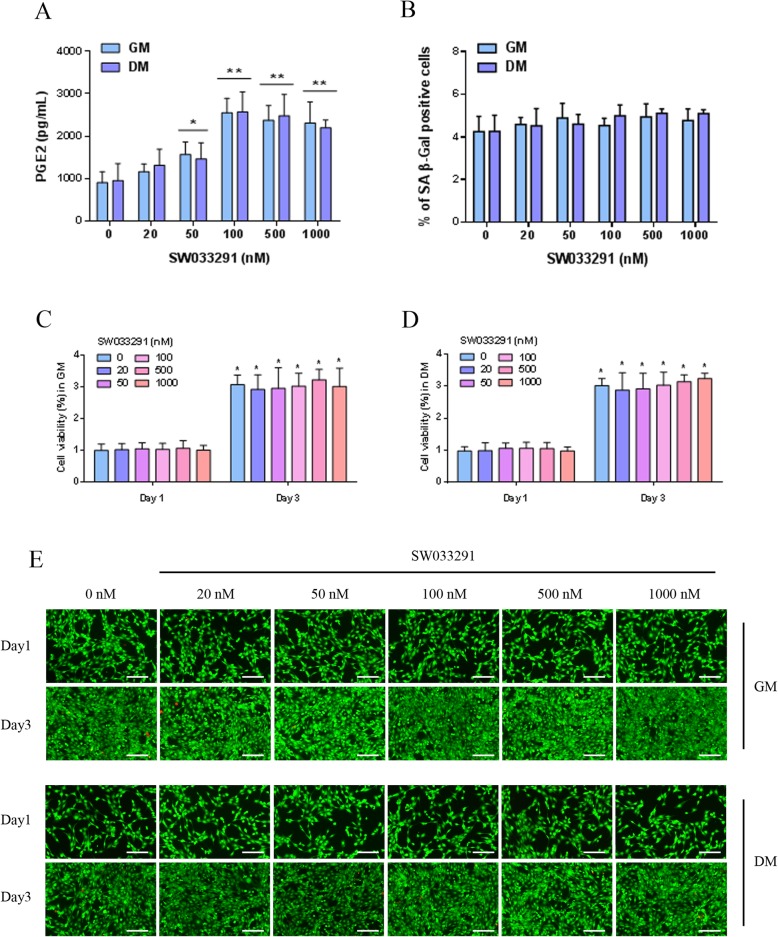
Fig. 2.
a PGE2 level produced by MDSCs cultured in DM and GM treated with different concentration of SW033291. b Percentage of SA-β-Gal positive MDSCs in DM and GM treated with different concentration of SW033291. c Cell viability of MDSCs in GM and d DM under different concentration of SW033291 treatment on day 1 and day 3. e LIVE/DEAD staining of MDSCs cultured in DM and GM treated with different concentration of SW033291 on day 1 and day 3; live MDSCs stained in green and dead cell in red, scale bar 100 μm. *P < 0.05, **P < 0.01

