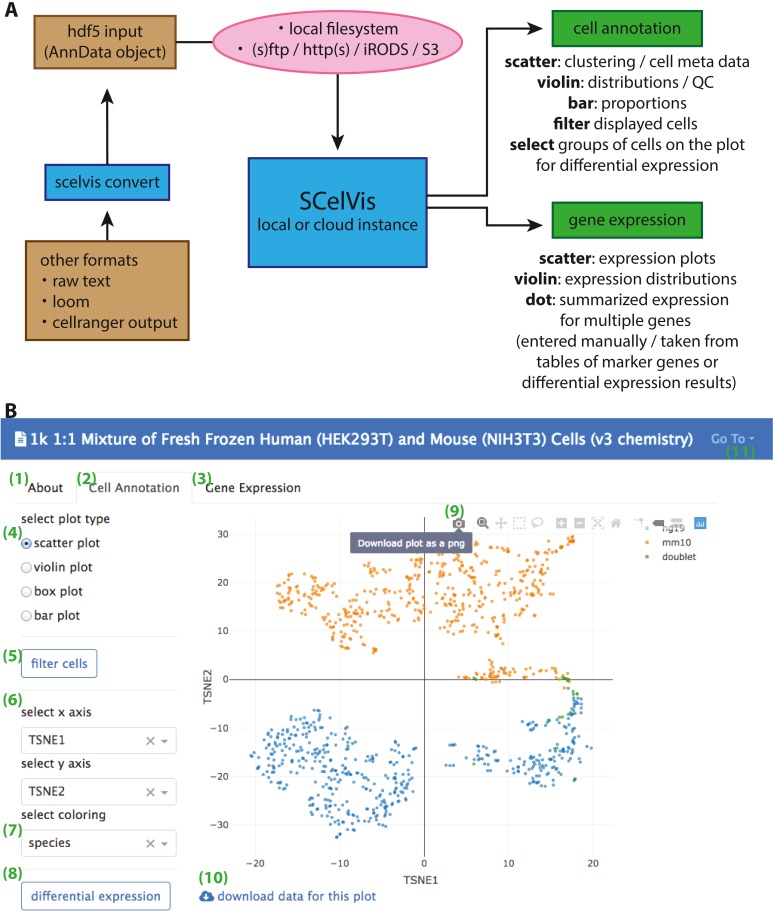
Figure 1. Overview of SCelVis Architecture and User Interface.
(A) Data can be converted from CellRanger output, loom format or raw text to an input HDF5 file with the SCelVis converter. These files can be uploaded into the web app or loaded remotely via various protocols such as S3, HTTP, etc. SCelVis can then be run locally or on a server/in the cloud and provides various views of the analysis results. (B) Screenshot of the SCelVis interface for a mixture of human and mouse cells from 10X Genomics. Users can browse the “about” tab to obtain background information on the data (1), select the “cell annotation” tab (2) to investigate cell meta data or the “gene expression” tab (3) to interrogate gene expression. The cell annotation view provides scatter, violin, box and bar plots (4). Displayed cells can be filtered (5) by a number of criteria. In typical cases, the scatter plot would be configured with embedding variables on the x- and y-axis (6) and a categorical or continuous variable for the coloring (7). Differential gene expression (8) can be performed by manually selecting groups of cells on the scatter plot, using “box select” or “lasso select” in hover bar on the top right-hand corner of the plot (9). Here, plot results can also be downloaded in png format. The underlying data can be obtained from a link at the bottom left (10). Other datasets can be selected, uploaded or converted from the menu on the top right (11).

