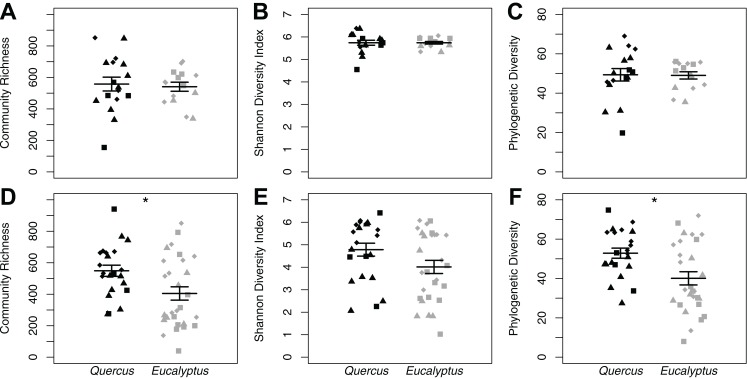
Figure 2. Alpha diversity dot plots with mean (long horizontal line) and standard errors (short horizontal line).
Data is presented for microhabitat soil (A–C) and Batrachoseps attenuatus skin (D–F) microbiota samples. Alpha diversity measures presented include community richness (A and D), Shannon Diversity index (B and E), and Phylogenetic Diversity (C and F). Each point represents the bacterial skin community of an individual sample; point color indicates dominant vegetation of the habitat (Black—Quercus agrifolia and gray—Eucalyptus globulus) and shape indicates site identity (square—site 1, triangle—site 2, and diamond—site 3).

