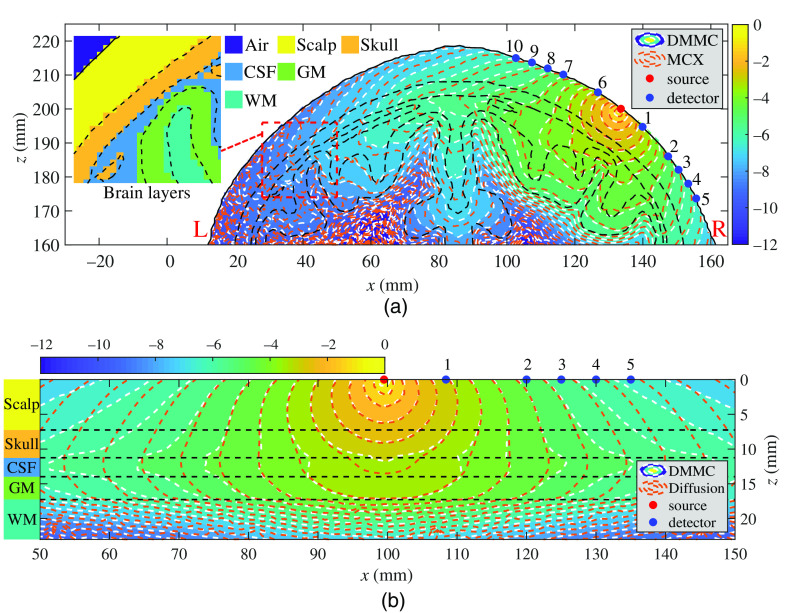
Fig. 10.
Comparisons of fluence distributions in an MRI brain atlas (19.5 years) using three different brain models: (a) MC fluence maps using anatomically derived mesh (computed using DMMC) and voxel (computed using MCX) brain representations, and (b) fluence maps computed using the MC and DA in a simple layered-slab brain model. Contour plots, in log-10 scale, are shown along the coronal planes with each brain tissue layer labeled and delineated by black dashed lines. In (a), the “L” and “R” markings (red) indicate the left brain and the right brain, respectively. The comparisons between the mesh and voxel tissue boundaries are shown in the inset of (a).

