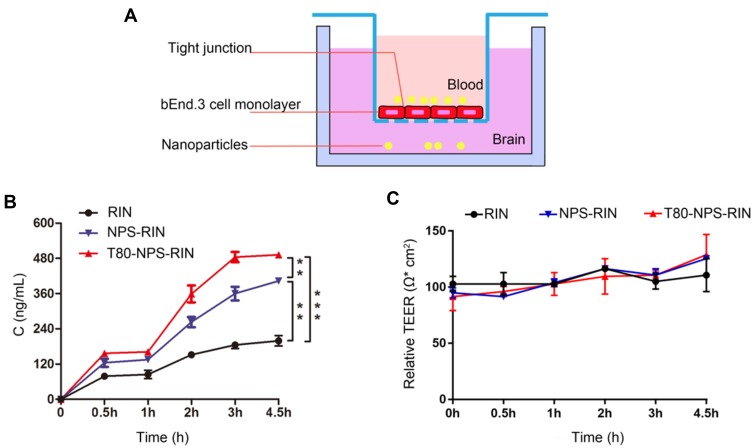
Figure 4.
Transportation of RIN loaded nanoparticles across the BBB model in vitro. (A) The schematic diagram of BBB model in vitro. (B) Concentration cellular permeation of RIN when treated as a plain RIN solution, NPS-RIN, and T80-NPS-RIN on mouse brain endothelial (bEnd.3) cell monolayer. (C) The fluctuation of TEER value during the permeation experiment. Results are denoted as mean ± SD (n=3), **P < 0.01, and ***P <0.001.

