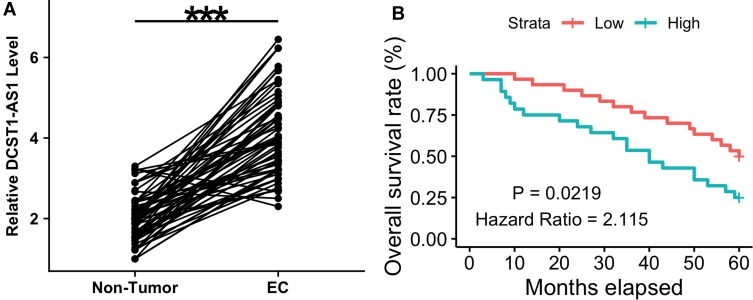
Figure 1.
Upregulation of DCST1-AS1 in EC predicted poor survival. The differential expression of DCST1-AS1 in EC was analyzed by measuring the expression levels of DCST1-AS1 in both EC and non-tumor tissues from the 62 EC patients. Data were compared between two types of tissues by performing a paired t test (A). PCR reactions were repeated 3 times and mean values were presented. ***p<0.001. The 62 EC patients into high and low DCST1-AS1 level groups (n=31) with the median expression level of DCST1-AS1 in EC tissues as the cutoff value. Survival curves were plotted and compared by the K-M plotter and log-rank test, respectively (B).

