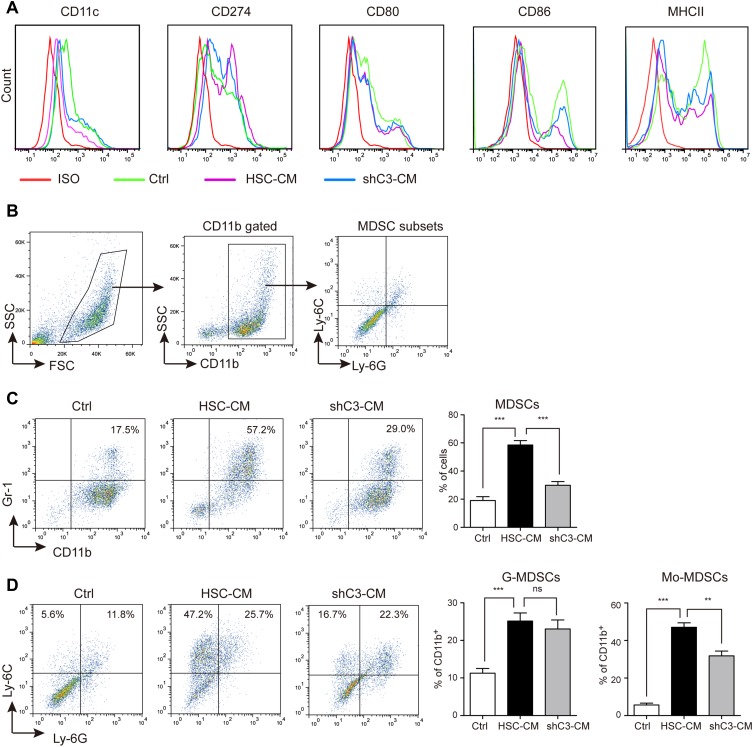
Figure 2.
HSCs inhibit bone marrow (BM)-derived DC differentiation through the C3 pathway. (A) Flow cytometry analysis of cell surface marker expression in DC differentiation in Ctrl medium (1640 medium), HSC-CM (conditional medium from HSCs), or shC3-CM (conditional medium from shC3 HSCs). (B) The gating strategy of MDSC subsets. (C) The MDSC expression in Ctrl, HSC-CM, or shC3-CM media. Number is percent of the cell population represented by MDSCs. (D) The G-MDSC and Mo-MDSC expression in Ctrl, HSC-CM, or shC3-CM media. Percent G-MDSCs was calculated as follows: corrected G-MDSC percent = 100% × CD11b+ percent × Ly6G+Ly6Clow percent. Corrected Mo-MDSC percent = 100% × CD11b+ percent × Ly6G−Ly6Chigh percent. The statistical significance was labeled as ***p < 0.001; **p < 0.01; ns, p > 0.05, n = 3.

