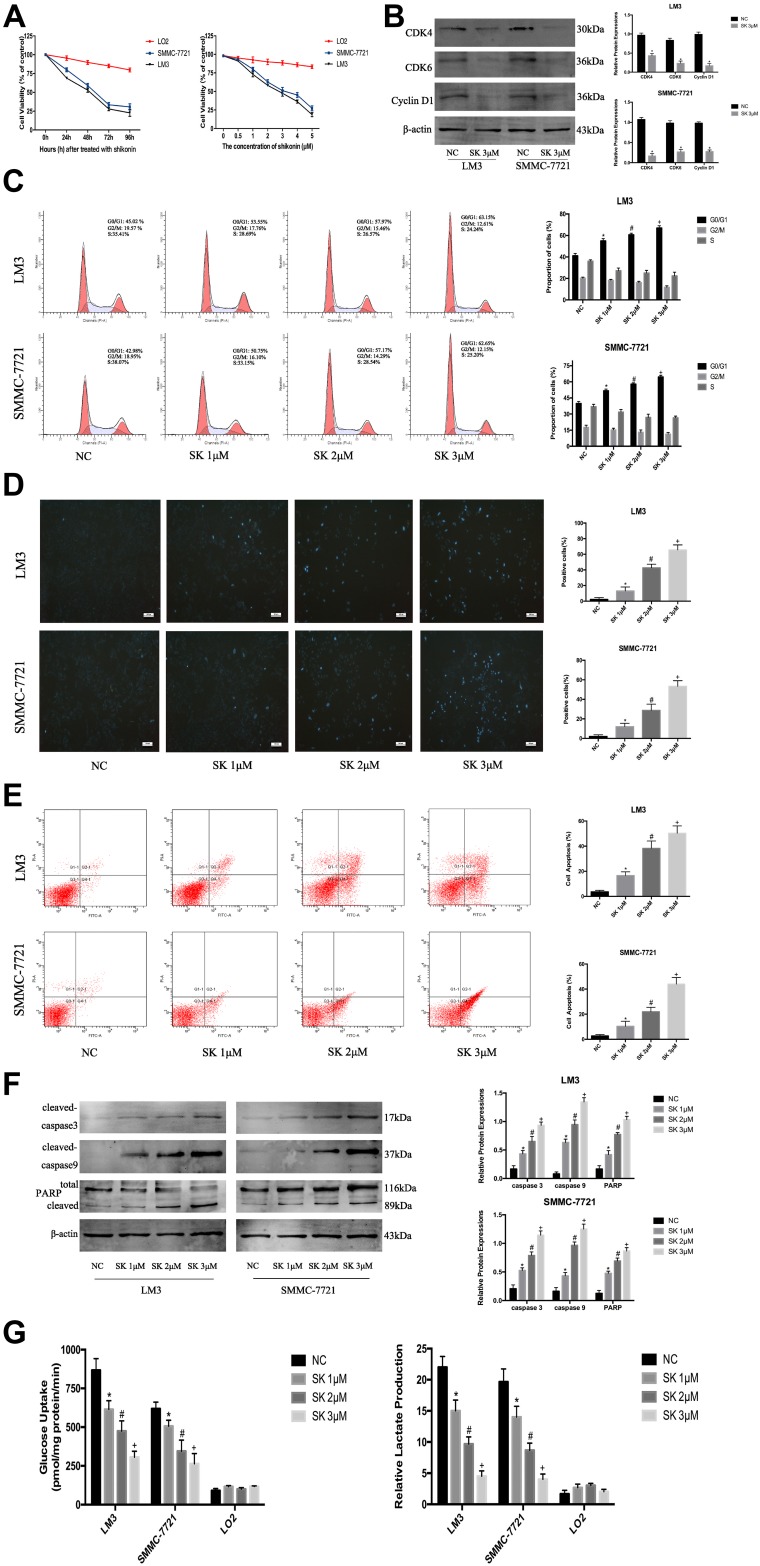
Figure 2.
The anti-tumor effects of SK in HCC cells. (A) HCC cells (SMMC-7721 and LM3) and normal liver cells (LO2) were treated with SK (0–5 μM) for 48 h and cell viability was determined by CCK8 assays. HCC cells and normal liver cells were treated with SK (3 μM) for 24–96 h and cell viability was determined by CCK8 assays (n = 3). (B) Western blotting was used to detect the expression of G0/G1 phase-related proteins in LM3 and SMMC-7721 cells treated with SK (3 μM) for 24 h. Data are expressed as the mean ± SD (n = 3, *P < 0.05 for SK [3 μM] vs NC). (C) Cell cycle analysis of HCC cells treated with SK for 24 h. Proportion of cells in different phases of the cell cycle is shown (n = 3, *P < 0.05 for SK [1 μM] vs NC, #P < 0.05 for SK [2 μM] vs SK [1 μM], and +P < 0.05 for SK [3 μM] vs SK [2 μM] in G0/G1 phase). (D and E) Apoptosis of LM3 and SMMC-7721 was detected by Hoechst 33342 and flow cytometry (magnification 200 ×). The data are expressed as the mean ± SD (n = 3, *P < 0.05 for SK [1 μM] vs NC, #P < 0.05 for SK [2 μM] vs SK [1 μM], and +P < 0.05 for SK [3 μM] vs SK [2 μM]). (F) Expression of cleaved-caspase 3, cleaved-caspase 9, and PARP protein was detected by Western blotting. β-actin was used as a loading control. The gray values were calculated. The data are expressed as the mean ± SD (n = 3, *P < 0.05 for SK [1 μM] vs NC, #P < 0.05 for SK [2 μM] vs SK [1 μM], and +P < 0.05 for SK [3 μM] vs SK [2 μM]). (G) HCC cells (LM3 and SMMC-7721) and normal liver cells (LO2) were treated with SK for 48 h. Glucose uptake and relative lactate production were analyzed. The data are expressed as the mean ± SD (n = 3, *P < 0.05 for SK [1 μM] vs NC, #P < 0.05 for SK [2 μM] vs SK [1 μM], and +P < 0.05 for SK [3 μM] vs SK [2 μM]).

