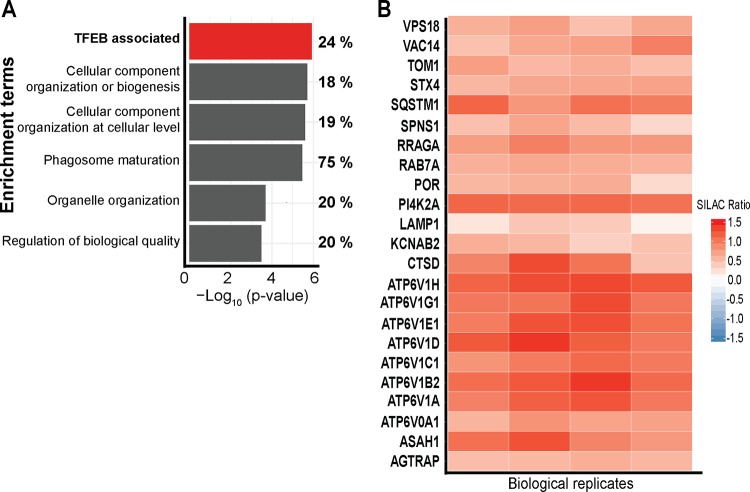
FIG 1.
C. burnetii infection leads to a host cell proteome shift that supports increased lysosome biogenesis. (A) GO-based enrichment of proteins involved in various biological processes analyzed using Fisher’s exact enrichment analysis. Percentages represent the proportions of proteins enriched in each category compared to the observable proteome. (B) Heat map of proteins with TFEB-associated gene expression. Color represents the SILAC ratio for each of four biological replicates, where red represents an increase in C. burnetii-infected THP-1 cells.

