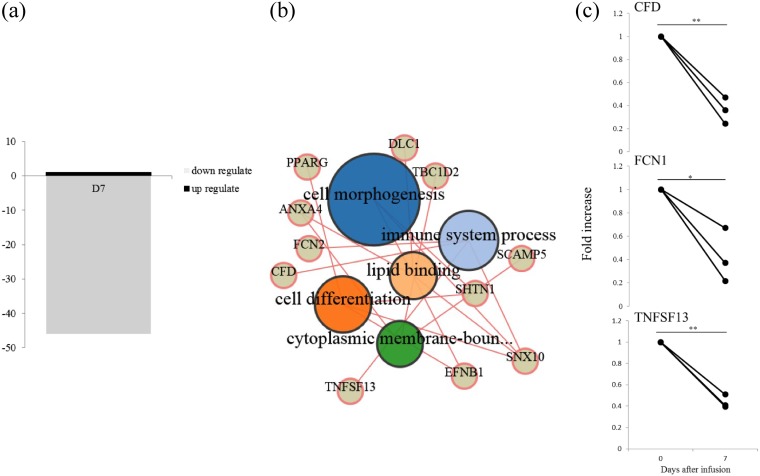
FIG 4.
Microarray analysis in blood MNCs following intramammary infusion of M. bovis. Blood MNCs evaluated at days 0 and 7 postintramammary infusion of M. bovis in three cows. (a) Number of significantly downregulated or upregulated mRNAs; (b) gene ontology term enrichment analysis of genes recognized as significantly different in blood MNCs following intramammary infusion of M. bovis; (c) quantification of mRNA expression by microarray analysis; significant difference at *P < 0.05 and **P < 0.01 compared with day 0.

