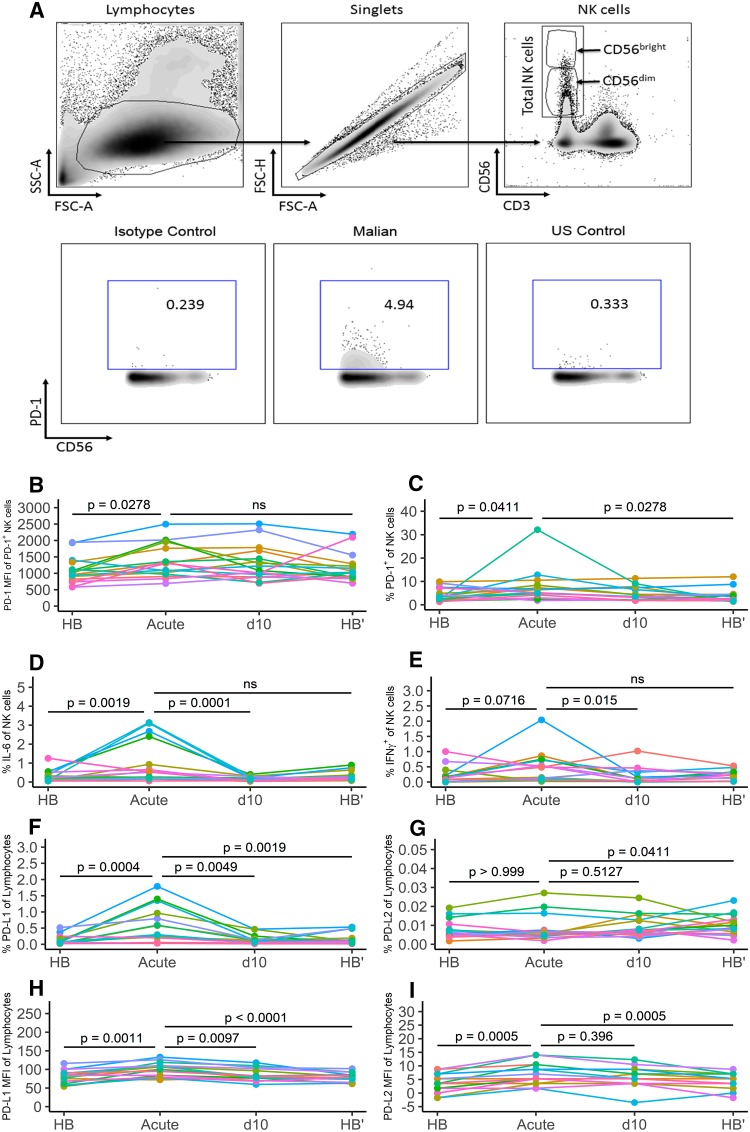
FIG 1.
In some children, acute malaria induces PD-1 expression and IL-6 production in NK cells and PD-L1 and PD-L2 expression on other lymphocytes. PBMCs were collected from the same children (n = 17) at four time points over 12 months: at the healthy uninfected baseline before the 6-month malaria season (HB), just prior to treatment of the first febrile malaria episode of the ensuing malaria season (acute), 10 days after malaria treatment, when symptoms had resolved (d10), and at the healthy uninfected baseline after the subsequent 6-month dry season (HB′). Surface and intracellular staining of PBMCs was done directly ex vivo without prior culturing or restimulation. (A) Upper panel, gating strategy to identify CD56bright, CD56dim, and total NK cells. Lower panel, representative plots of PD-1-expressing NK cells: left, PD-1 isotype control staining of NK cells; middle, PD-1-expressing NK cells of a Malian adult; right, PD-1-expressing NK cells of a U.S. adult. (B and C) Median fluorescence intensity (MFI) of PD-1 on PD-1-expressing NK cells (B) and percentage of PD-1-expressing NK cells of total NK cells (C) at the indicated time points. (D and E) Ex vivo intracellular cytokine staining for IL-6 (D) and IFN-γ (E) in NK cells at the indicated time points. (F to I) Percentage of lymphocytes expressing PD-L1 (F) and PD-L2 (G) and MFI of PD-L1 (H) and PD-L2 (I) on lymphocytes at the indicated time points. (B to I) P values were determined using the Friedman test, with a comparison of results for HB, d10, and HB′ to those at the acute time point. Individual subjects are color coded. ns, not significant.

