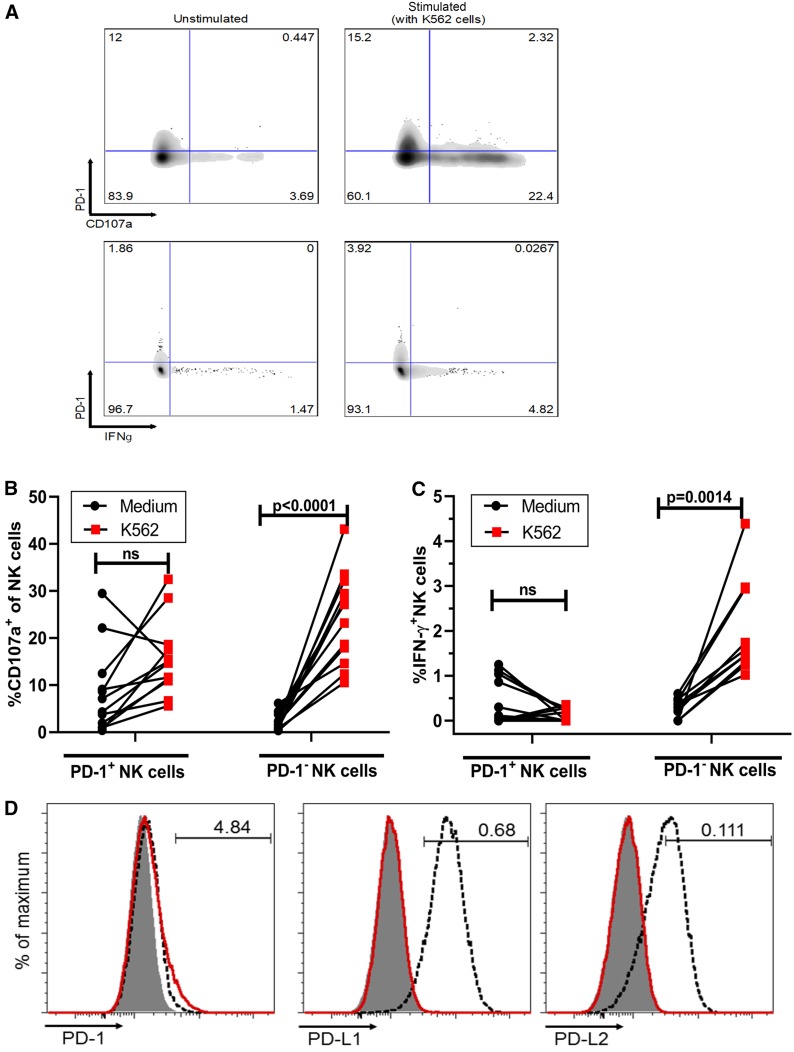
FIG 4.
PD-1 expression on NK cells is associated with diminished activation by K562 cells. (A) Representative flow cytometry plots of CD107a (upper panels) and IFN-γ (lower panels) producing PD-1+/− NK cells (total NK cells, gating as shown in Fig. 1A) among PBMCs with or without 5 h of stimulation with K562 targets cells. (B and C) Percentage of CD107a-positive (B) and IFN-γ-positive (C) NK cells stratified by PD-1 expression following stimulation of PBMCs (n = 12) with medium alone or K562 cells. (D) K562 and .221 cells stained for PD-1, PD-L1, and PD-L2. K562 cells with the isotype control are indicated by a gray background, K562 cells stained with the indicated antibody are indicated by a red line, and .221 cells stained with the indicated antibody are indicated by a dashed line. The .221 cell line control is HLA null and expresses PDL1 and PDL2. P values were determined by Friedman’s matched pairs test with Dunn’s test adjustment. Data are shown as matched pairs.

